Data Quality
Overview
Data Quality in DataDios is a dedicated module (left sidebar → Data Quality) built around three tabs: Overview, Rules, and Incidents. Rules roll up into Quality Hubs, and rule failures that cross a pass-rate threshold automatically surface as Incidents.
Creating the underlying data source/hub happens in Data Explorer, while day-to-day rule authoring, monitoring, and triage happen in the Data Quality module described below.
The customer workflow, end to end
- Create a Quality Hub (once per environment) — a data source of type
DQ HUB, created in Data Explorer. - Add rules to the hub — either a manual SQL rule, an AI eval rule, or a bulk AI-generated set.
- Watch rules run — manually or on a schedule — and check pass/fail results.
- Failures surface as Incidents — a rule failing below its pass-rate threshold appears in the Incidents log for follow-up.
Getting Started
Step 1: Create a Quality Hub
Quality Hubs are created the same way as any other data connection.
Navigation: Left sidebar → Data Explorer → Add connection
Dialog: The "Create data source" modal opens, with tabs Connection and Drift. A Quality Hub declares no profiling or workload capability, so those tabs do not appear for this source type.
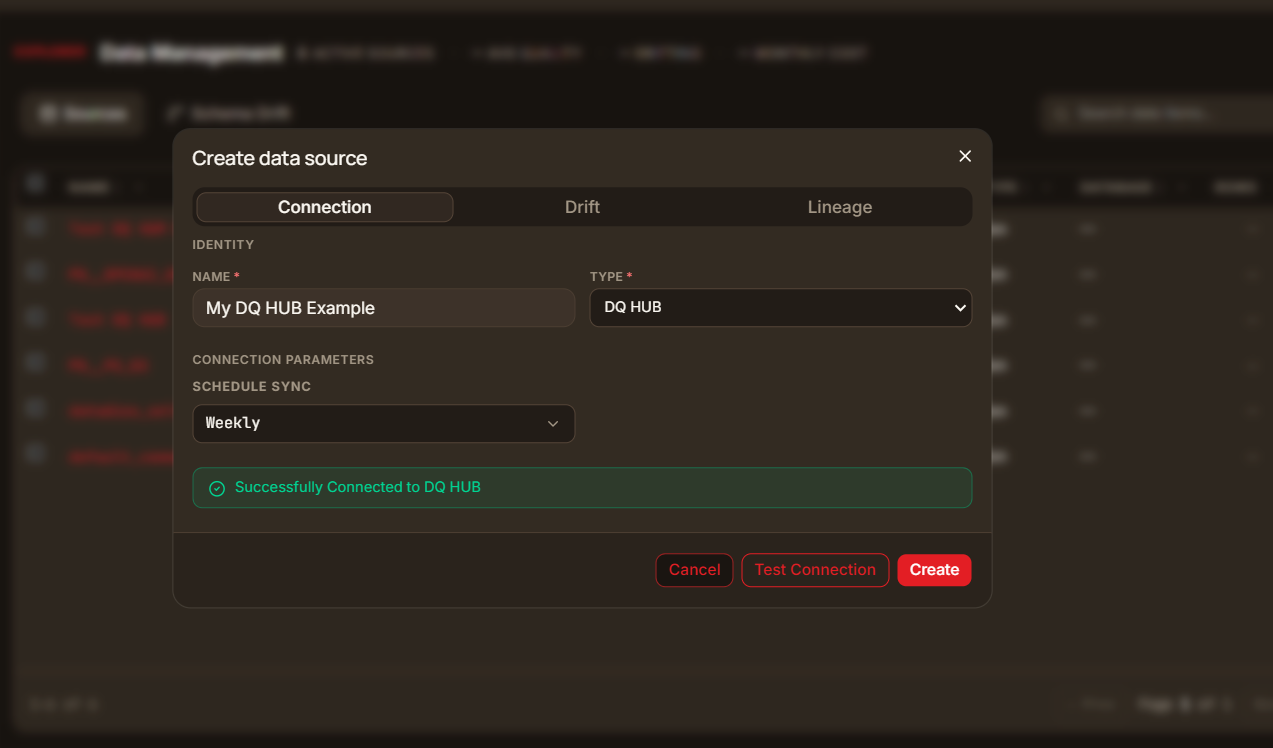
The tab strip in this screenshot predates 2026-09-09 and still shows a Lineage tab. That tab was removed; the tabs listed above are what the dialog renders today. Recapture is tracked in dd-docs#208.
Fields (Connection tab):
| Field | Description | Example |
|---|---|---|
| Name* | Descriptive name for the hub | my_postgres |
| Type* | Data source type — defaults to DQ HUB | DQ HUB |
| Schedule Sync | Optional periodic sync frequency | e.g. Hourly, Weekly |
Actions: Cancel / Test Connection / Create
Existing hubs and other connections are listed under Data Explorer → Data Management, grouped by category in the left-hand catalog (e.g. a Data Quality group for DQ HUB sources, alongside Database, Gen AI Models, Command Registry, and Service groups).
Step 2: Create a rule
Navigation: Data Quality → Rules tab → Add rule
This opens the Create rule picker, offering three paths:
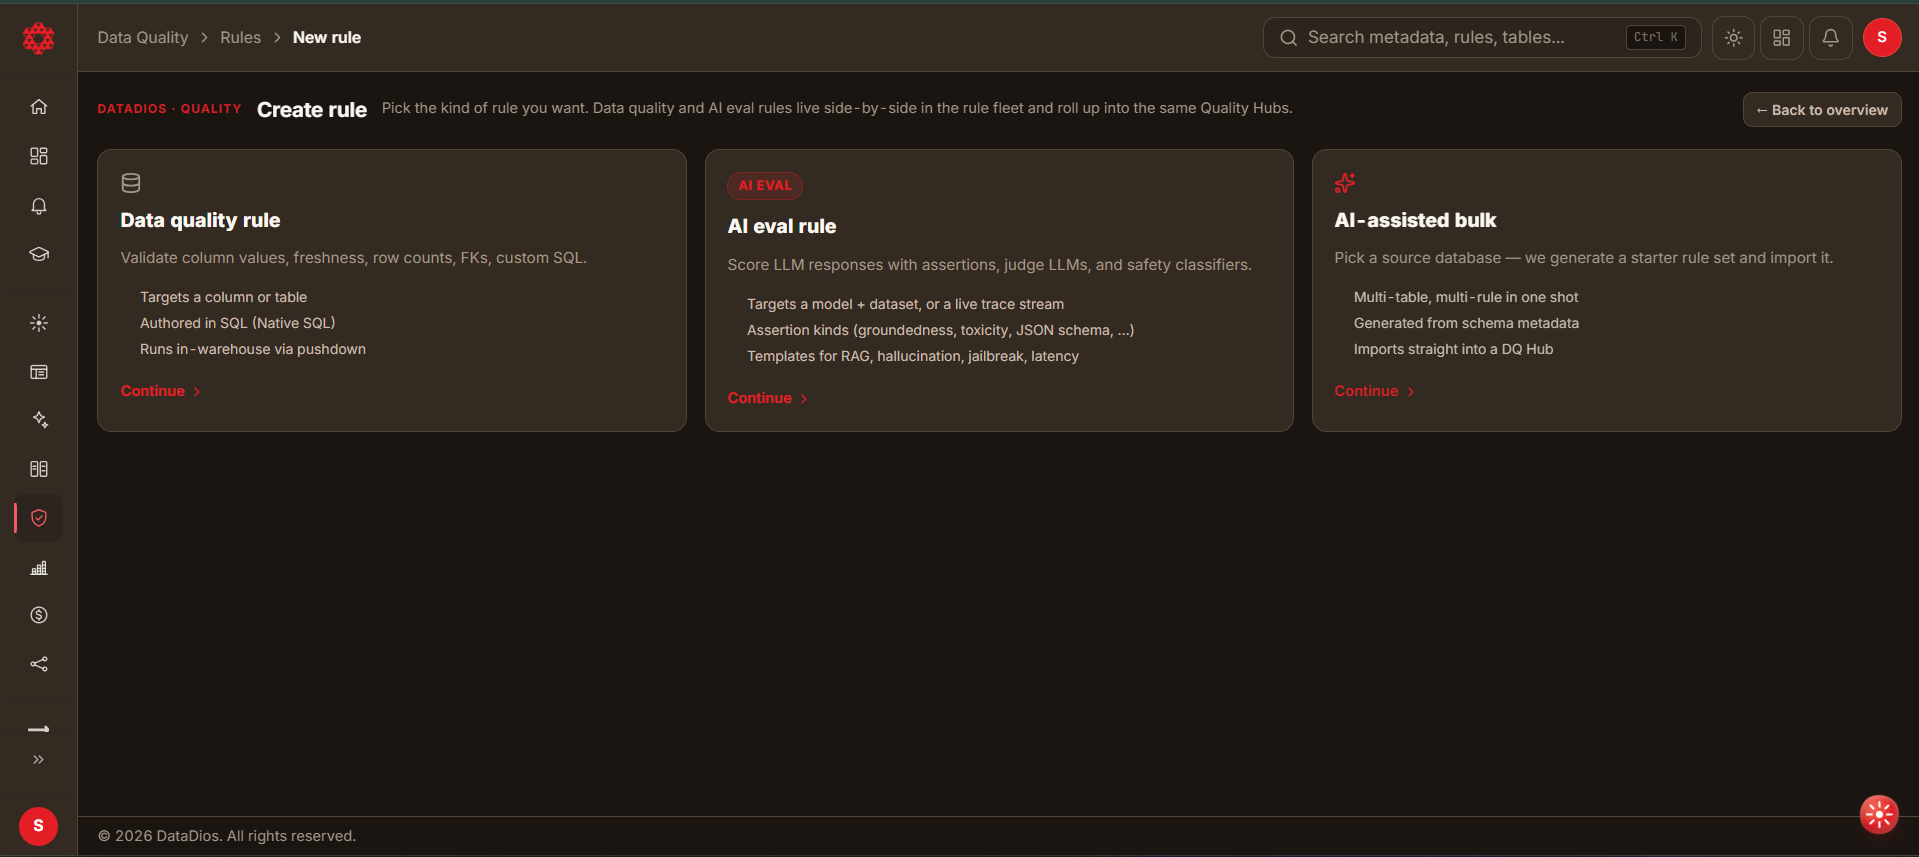
Option A — Data quality rule
Validate column values, freshness, row counts, FKs, or custom SQL.
- Targets a column or table
- Authored in SQL (Native SQL)
- Runs in-warehouse via pushdown
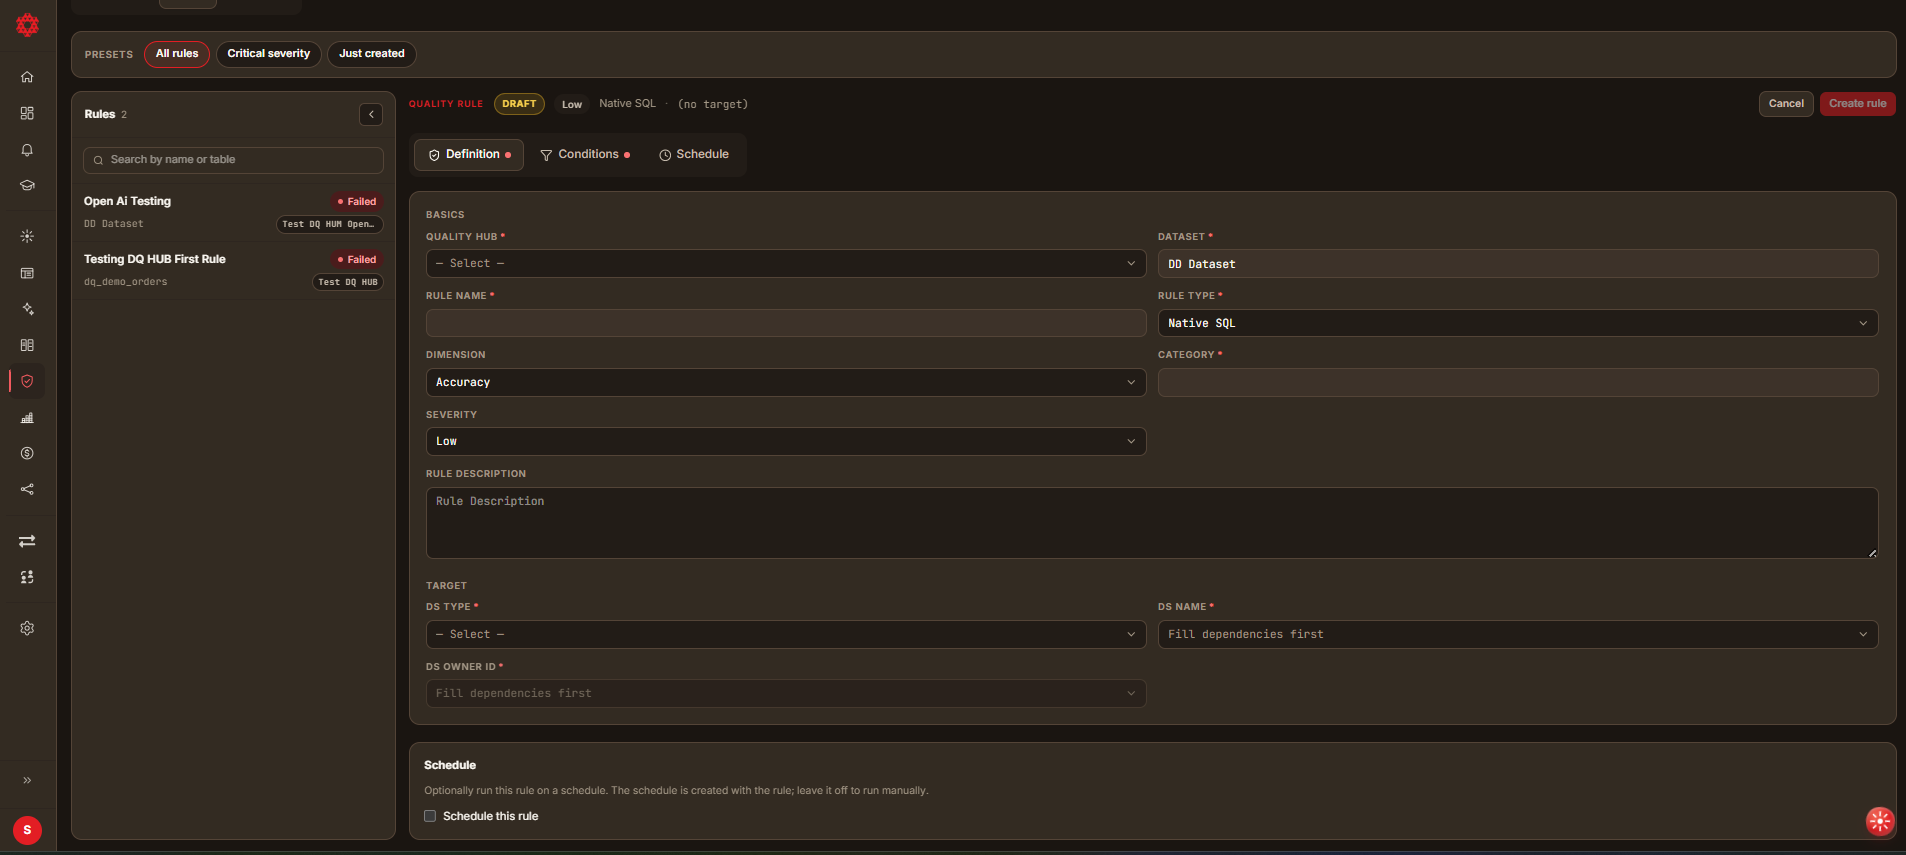
| Section | Fields |
|---|---|
| Basics | Quality Hub*, Dataset*, Rule Name*, Rule Type*, Dimension, Category*, Severity, Rule Description |
| Target | DS Type*, DS Name*, DS Owner ID* |
| Conditions | Rule Value* (SQL — the query must return failing rows), Max Rows, Timeout Seconds |
| Schedule | Optional — a "Schedule this rule" toggle; when on, set a Start time, a Repeat interval (Don't repeat / Hourly / Daily / Weekly / Monthly), and (if repeating) an Until time; the rule runs manually if left off |
Example rule value:
SELECT *
FROM dq_demo_orders
WHERE ORDER_ID IS NULL;
Option B — AI eval rule (BETA)
Score LLM responses with assertions, judge LLMs, and safety checks.
- Targets a model + dataset
- Templates for RAG, hallucination, jailbreak, latency, and more
Selecting this path opens a template gallery — pick Blank eval rule or one of the pre-baked templates:
| Template | Dimension | Severity |
|---|---|---|
| RAG groundedness | faithfulness | Critical |
| Faithfulness | faithfulness | Error |
| Answer relevance | relevance | Warning |
| Helpfulness + tone | accuracy | Warning |
| Hallucination detector | accuracy | Critical |
| Toxicity guardrail | safety | Critical |
| PII leak | safety | Critical |
| Jailbreak resistance | safety | Critical |
| Bias detection | safety | Error |
| Output format — JSON schema | validity | Error |
| Latency budget | timeliness | Warning |
| Cost budget | timeliness | Warning |
| Exact match | accuracy | Error |
| Semantic similarity | accuracy | Warning |
| Prompt regression suite | accuracy | Warning |
| Summarization quality | faithfulness | Warning |
Conditions fields: Rule Value* (the prompt/model configuration), Eval dataset (optional — the test cases the prompt runs against), Expression* — one or more assertions, each with:
| Assertion field | Description |
|---|---|
| Kind | The check to run — see full list below |
| Weight | Relative weight of this assertion |
| Comparison | e.g. == |
| Threshold | Pass/fail cutoff |
| Failure message (optional) | Custom message shown on failure |
Assertion kinds available:
| Kind | What it checks |
|---|---|
| row count | The number of rows returned or produced |
| contains | The response contains a required substring |
| output length | The response length falls within bounds |
| groundedness | Claims in the response are supported by the retrieved context |
| faithfulness | The response doesn't introduce facts outside the given context |
| answer relevance | The response actually addresses the question asked |
| helpfulness | The response is helpful and appropriately toned |
| tone | The response matches an expected tone (e.g. professional, empathetic) |
| hallucination | The response contains no unverifiable or contradictory claims |
| toxicity | The response stays below a toxicity threshold |
| pii leak | The response contains no personally identifying information |
| prompt injection | The response ignores injected/adversarial instructions in the input |
| bias | The response stays below a bias threshold across demographic axes |
| is json | The response is valid JSON |
| json schema | The response conforms to a provided JSON schema |
| latency | The response completes within a time budget |
| cost | The call stays within a cost budget |
| exact match | The response equals the expected output |
| semantic similarity | The response is semantically close to the expected output |
Also configurable: Max response length (default 50000), Timeout seconds (default 60).
At least one assertion is required — the form blocks rule creation until you add one.
Option C — AI-assisted bulk
Point at a source database and generate a starter rule set automatically, covering many tables in one pass. See Generate DQ Rules for the full walkthrough of this flow.
Steps:
- Pick a data source — search/select an existing connection (MySQL, PostgreSQL, or SQL Server).
- Pick objects to monitor — checkbox list of tables (capped at 25 per batch), with a filter box and Select all visible / Clear actions.
- Tune defaults + generate — choose a Target DQ Hub, then click Generate rules. This only suggests rules — nothing is created yet.
- Review suggestions — every suggested rule, grouped by table and accepted by default; uncheck or remove any you don't want, then click Create N rules to actually write them into the hub.
Once you click Create N rules, the new rules appear in the Rules tab under the target hub — use the "Just created" preset to find them quickly.
Step 3: Manage and inspect rules
Navigation: Data Quality → Rules tab
The Rules tab is a master-detail view:
- Left: a searchable, filterable rule list, paginated (25/50/100 rows per page, default 50, with Previous/Next). Presets: All rules, Critical severity, Just created.
- Right: the selected rule's detail panel, with header actions Delete, Run rule, Close, and Share (shown but disabled — "Coming soon"). A Save changes button appears automatically once you've edited something in the Definition or Conditions tab — and five sub-tabs:
| Sub-tab | Contents |
|---|---|
| Definition | Rule Name, Rule Kind, Owner, Quality Hub, Dataset, Source Type, Source, Table, and Pass Rate are read-only. Severity (High/Medium/Low) and Dimension (Accuracy, Completeness, Consistency, Timeliness, Uniqueness, Validity) are editable dropdowns; Category and Description are editable text fields |
| Conditions | Depends on the kind of rule. A SQL rule has a SQL editor labeled "SQL — must return failing rows". An AI eval rule has a Prompt — sent to the model box and, below it, its Test cases. A JQ rule has a JQ editor with a template picker. A rule built from a structured kind (range, allowed values, anomaly and so on) shows its configuration read-only: the kind is fixed after creation, and editing its settings isn't supported yet. Every rule also lists its grading assertions, read-only |
| Schedule | A "Schedule this rule" toggle; when on, set a Start time, a Repeat interval (Don't repeat / Hourly / Daily / Weekly / Monthly), and — if repeating — an Until time. A summary line below reflects the saved schedule (e.g. "Manual only — no schedule." or "Repeats weekly from ..."). Changes need a separate Save schedule click |
| Notifications | If the rule already has alerts, they're listed (name, condition, severity, muted state) with a + New alert button to add another; if it has none yet, the create-alert form shows directly. Fields: Alert Name, Entity (locked to this rule), Trigger, Severity, Channels — in-app delivery is always on; add email or messaging channels from the Alerts page |
| Results | A summary header — Runs, Pass rate, Mean duration and Last run — above two trend charts (case pass rate per run, and run duration), then the run history list. Each run row shows its execution ID, its passed/total case split (or rows affected, for a rule that reports rows rather than cases), how long it took, a relative time and a status pill. Expand a run for its detail: failing sample rows for a SQL rule, or a per-case table (Case, Result, Input, Response, Tokens, Latency, Cost) for an Evals rule. Empty state: "No runs recorded in the last 30 days" |
Clicking Run rule shows a toast with the result ("Rule passed — 0 failing rows." or "Rule failed — N failing rows.") and automatically switches to the Results tab. Delete asks for confirmation first — deleting a rule removes it and its schedule permanently, but keeps its run history.
Runs with no recorded verdict. A run from before DataDios stored a pass/fail result on the run itself shows an Unknown pill rather than being counted as a pass, and it is left out of the Pass rate — the sub-line under that number says how many runs were actually graded. The same applies to the charts: a run with no case split is not plotted.
The list shows the 50 most recent runs in the last 30 days, newest first, and says so below the list when there are more. When it is capped, the header reads Runs (latest) so the four numbers above are not mistaken for the rule's whole 30-day record. There is no pagination through older runs.
Test cases on an AI eval rule
An AI eval rule can run its prompt once per test case instead of just once. The test cases are a JSON array of objects, and each object's keys fill the {{…}} placeholders in the prompt:
[
  { "country": "France" },
  { "country": "Japan" }
]
With the prompt What is the capital of {{country}}?, that runs two prompts. The rule passes only if every case passes its assertions, and the Results tab shows each case's input, response and verdict. A case that lacks a placeholder the prompt uses fails on its own. By default a run grades at most 25 cases: a larger set fails the run, and the result says how many cases were never graded. The form has no setting for this. A rule created through the API can raise it to 50 with max_dataset_cases.
- To edit them, open the rule's Conditions tab, change the Test cases box under the prompt, then click Save changes. Leave the box empty to run the prompt once, with no cases.
- If the text isn't a JSON array of objects, the box shows "Test cases must be a JSON array of objects." Clicking Save changes then switches to the Conditions tab, shows the same message, and saves nothing until you fix the text or put back what was there. Edits to the rule's other fields still save as long as the test cases are left as they were.
- When creating a rule, the same cases go in the Eval dataset field on the Conditions tab — not the Dataset field under Basics, which names the rule's dataset. Eval dataset doesn't check the format. Text that isn't valid JSON is saved as typed and ignored, so the rule runs the prompt once. Valid JSON of the wrong shape, such as a single object or a list of plain values, is saved too, and every run then fails with "Evals dataset must be a list of case objects". Reopen the rule after creating it — its Conditions tab flags either kind of malformed set.
Step 4: Monitor via Overview
Navigation: Data Quality → Overview tab
The Overview tab is the fleet-wide health dashboard for Data Quality:
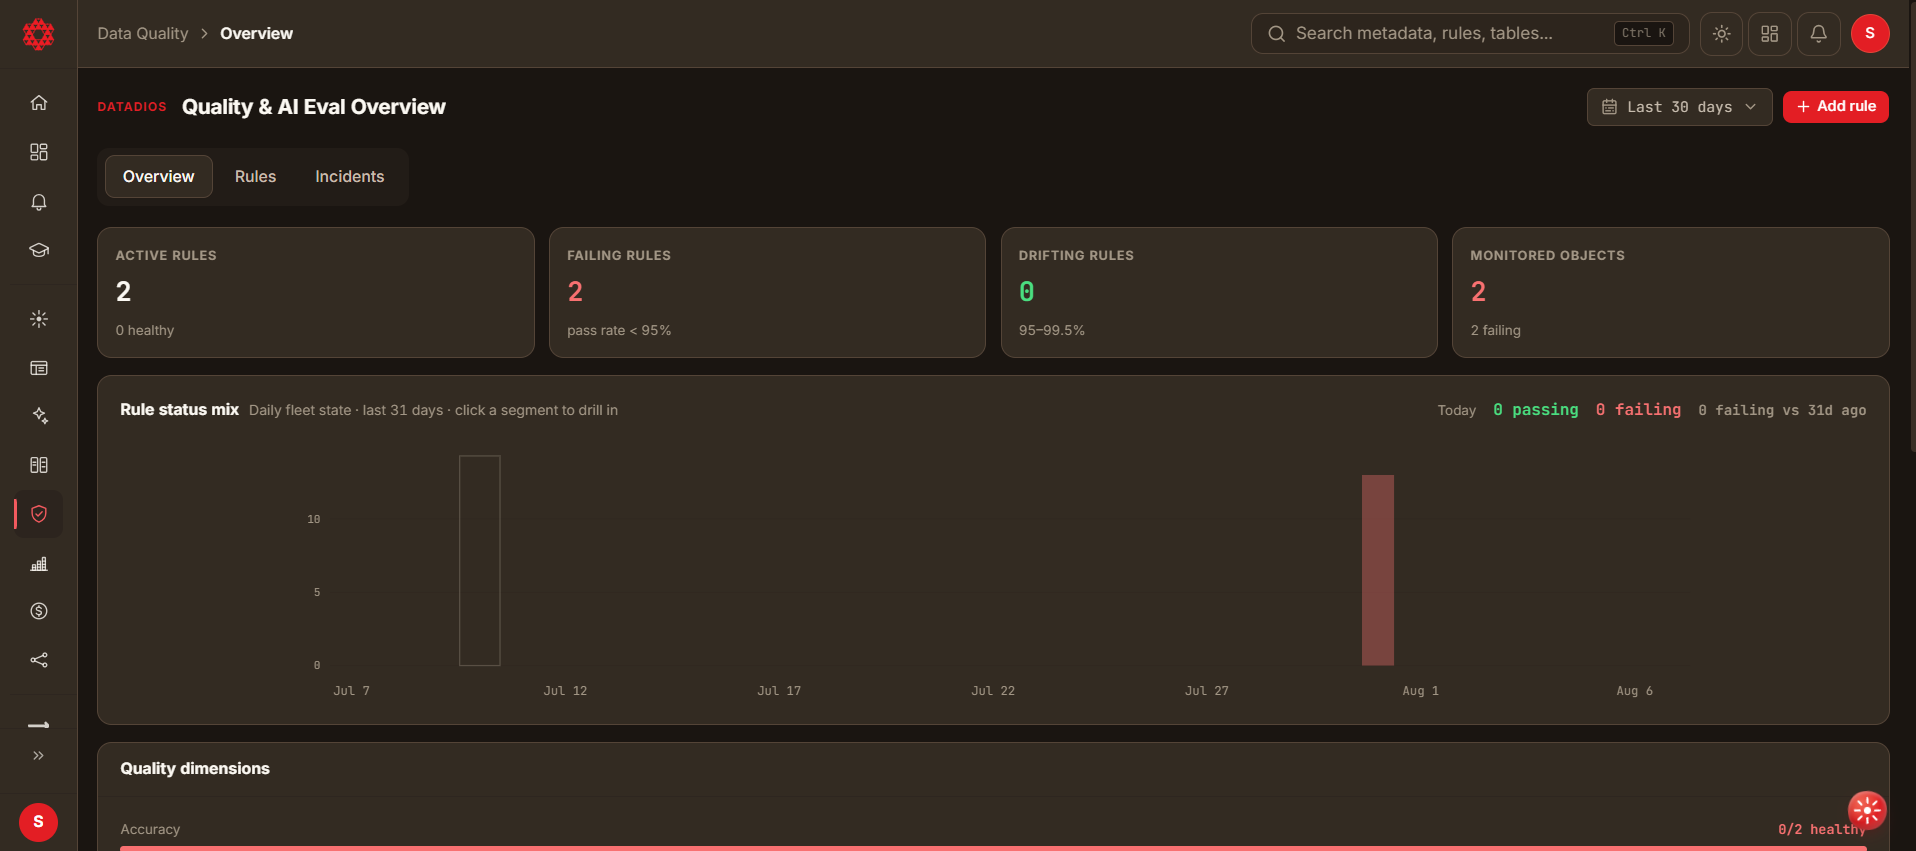
- Stat cards: Active Rules, Failing Rules (pass rate < 95%), Drifting Rules (95–99.5%), Monitored Objects — with a split beneath them showing how many rules are data-quality rules and how many are AI evals, and how many of each are failing
- Rule status mix: a daily stacked bar of passing and failing rule runs over the selected time range. Click today's passing or failing count above the chart to open the Rules tab
- Quality dimensions: a healthy/failing breakdown per dimension (e.g. Accuracy)
- DQ Hub Overview: a table of hubs with rule count, run status, and status — click a row to open that hub's own detail page
- Active Incidents: a short list of open incidents with a "View all" link to the Incidents tab
- Anomaly rules: anomaly rules grouped by what they watch (volume, null rate, freshness), with the share of each group currently failing. Empty until the hub has anomaly rules
- AI eval health: AI eval rules grouped by quality dimension, same shape. Empty on a hub with no eval rules — an empty group means "not used here", not "used and broken"
- Coverage: how many of the objects the platform has actually listed carry at least one rule, with a table of the ones that do not. See the note below
- Rule pressure: a two-tab card — Failing shows the rules with the most total failures right now (bar per rule); Degrading shows rules whose pass rate has slid versus their own prior window (prior % → recent %, with the drop in percentage points and the affected table)
- Rule run status by objects: a table of monitored objects with run counts and status
An object here is a specific table, identified by the data source it lives in together with its fully qualified name — database, schema and table, or catalog, schema and table on Trino. An engine with no schema level, such as MySQL, simply has one part fewer. Two data sources in the same hub can each hold a table called orders, and they count as two objects, list as two rows, and carry their own status. A staging database restored from production is the usual way this comes up.
Setting a hub's quality target (SLO). A Quality Hub can carry a commitment — a pass-rate it promises, measured over a rolling window. The hub's detail page shows a vs target chip beside its name saying whether it is meeting that promise and by how many percentage points.
- Pass-rate target — a percentage from 0 to 100. The default is 99. Common picks: 99 for production data, 99.5 or higher for finance and compliance lanes, lower for exploratory ones.
- Measurement window — whole days, 1 to 365. The default is 30. A shorter window reacts faster to a regression; a longer one smooths out noise.
Only a tenant administrator can change it, and the change applies to everyone: the target is stored once per hub for the whole tenant, so it decides what "meeting target" means on every dashboard your colleagues see. Everyone can read the chip; the Edit SLO button appears only for administrators.
A hub whose rules have not run inside the window shows "no runs in this window" rather than 0% — there is no pass rate to compare yet, and 0% would read as a breach that has not happened.
When Coverage shows a warning instead of a percentage. Coverage matches the objects your workflows have listed against the objects your rules say they target, using the fully qualified name as the key. If rules point at names that were never listed, those objects also count as uncovered — so the percentage would be dragged down by a mismatch rather than by a real gap. When the unmatched targets are numerous enough to move the figure by more than a point, the card shows how many could not be matched and withholds the percentage. Below that it shows the figure with a note naming the count, so a mapping that is slowly rotting is visible before it crosses the line.
Two other things it will not claim. If nothing has been listed in the current scope yet, it says so rather than reporting 0% or 100% — there is nothing to divide by until a workflow has run. And the table of uncovered objects is capped, so when there are more than it can show, the line beneath gives the real total.
A hub's detail page is this same dashboard, filtered to that hub — the same stat cards, trend chart, dimensions, anomaly and AI-eval breakdowns, coverage, rule pressure and object table, computed over that hub's rules alone rather than the whole fleet. Two cards are deliberately left out of it: the hub list, because the page is already about one hub and its name is in the header, and Active Incidents, because incident counts are not yet filtered per hub and the number shown would be the whole tenant's. One card is added that the fleet Overview does not have: Data sources in this hub, listing the data sources the hub's rules point at, how many rules each carries and how they are running — nothing else on the page answers where a hub's rules point.
Within a hub's detail page, clicking an object row opens that object's own page. The row names the object's data source as well as its table, so two sources holding a table of the same name open different pages.
The object page has three tabs:
- Overview — the same stat cards and run-status trend as the hub, narrowed to this one object.
- Rules — every rule that targets the object (name, dimension, severity, category), including rules that check the object as a whole rather than one of its columns.
- Columns — which of the object's columns have rules, and how those rules are running: rule count, runs, run-status mix and status per column, worst first. Only column-level rules appear here; a rule that targets the whole object is on the Rules tab. Long column lists are capped, and the card says so when it is showing a capped list.
A date-range selector (default Last 30 days) filters the whole page.
On a brand-new setup with no rules yet, the Overview tab shows a placeholder instead of empty cards: "No quality data yet — Create a DQ Hub, add rules (manually or AI-assisted), then run them." Inside a hub that has no rules yet, the same placeholder asks you to add rules to that hub rather than to create one.
Step 5: Triage failures via Incidents
Navigation: Data Quality → Incidents tab
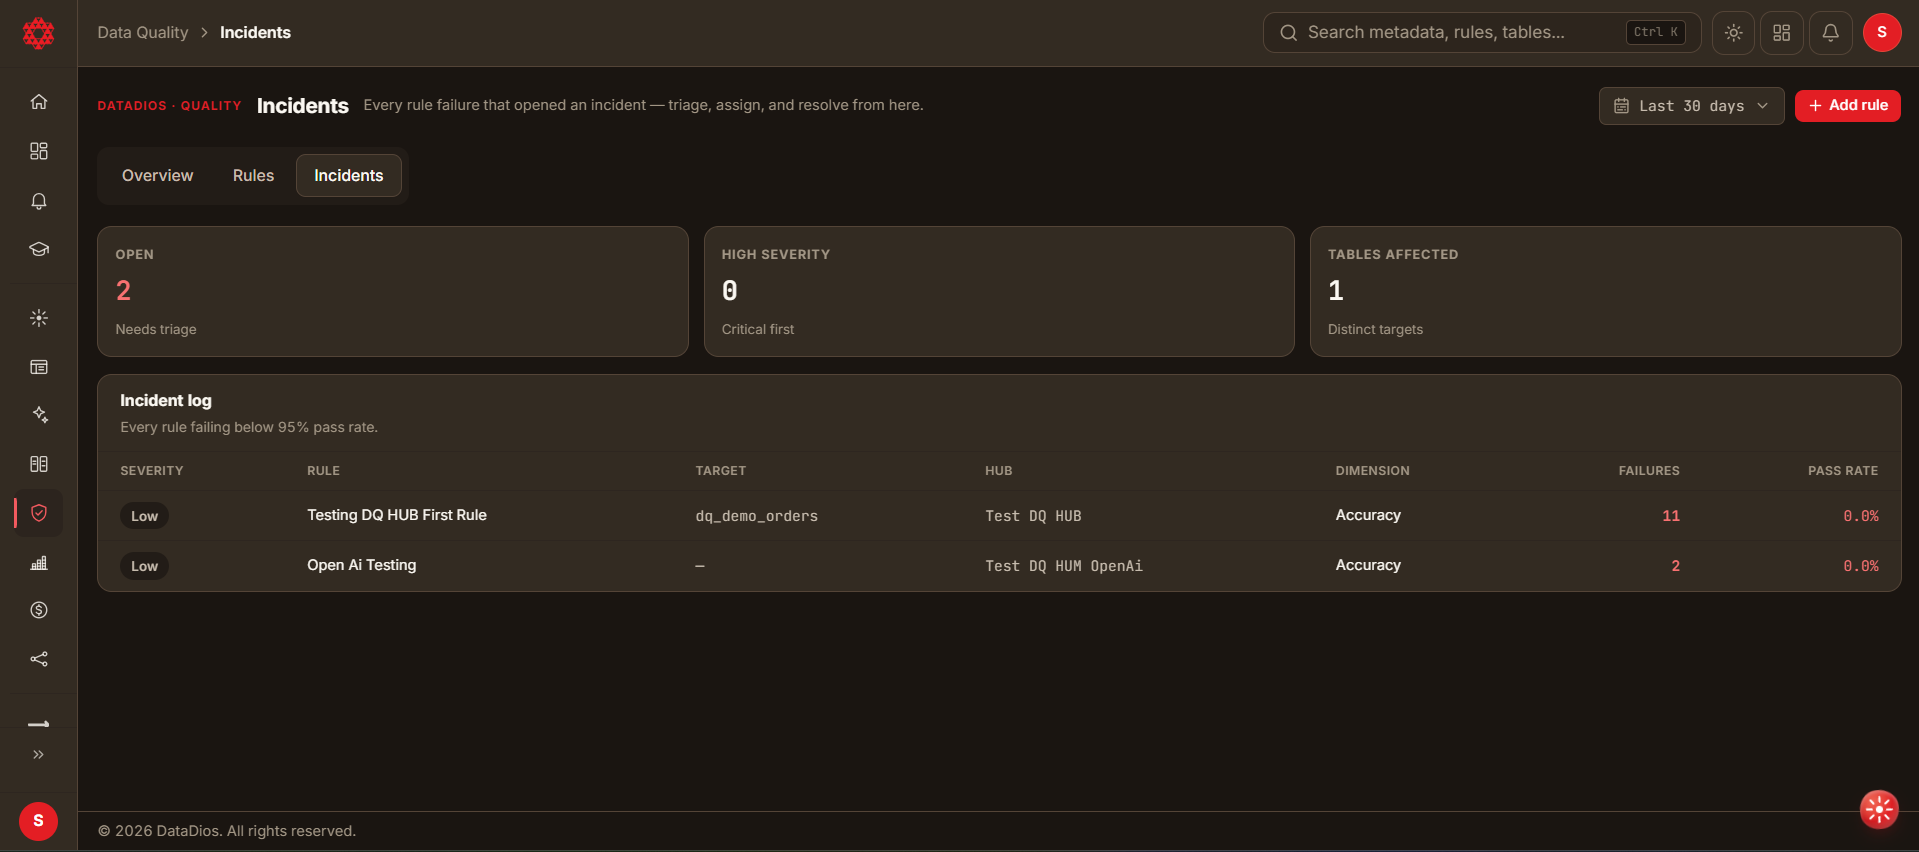
- Stat cards: Open (needs triage), High Severity (critical first), Tables Affected (distinct targets)
- Incident log: every rule failing below the 95% pass-rate threshold, with columns Severity, Rule, Target, Hub, Dimension, Failures, Pass Rate. Loads 25 at a time with a "Show more" button at the bottom for longer logs. Empty state: "No open incidents — every rule is passing above 95%."
The Incident log is currently a read-only overview — use it to see which rules are failing and where, at a glance. Dedicated triage, assignment, and resolution actions per incident are not yet available.
Related Documentation
- Generate DQ Rules (AI-Powered) — the full walkthrough of the AI-assisted bulk rule creation flow