Drill-down Graphs
Drill-down Graphs
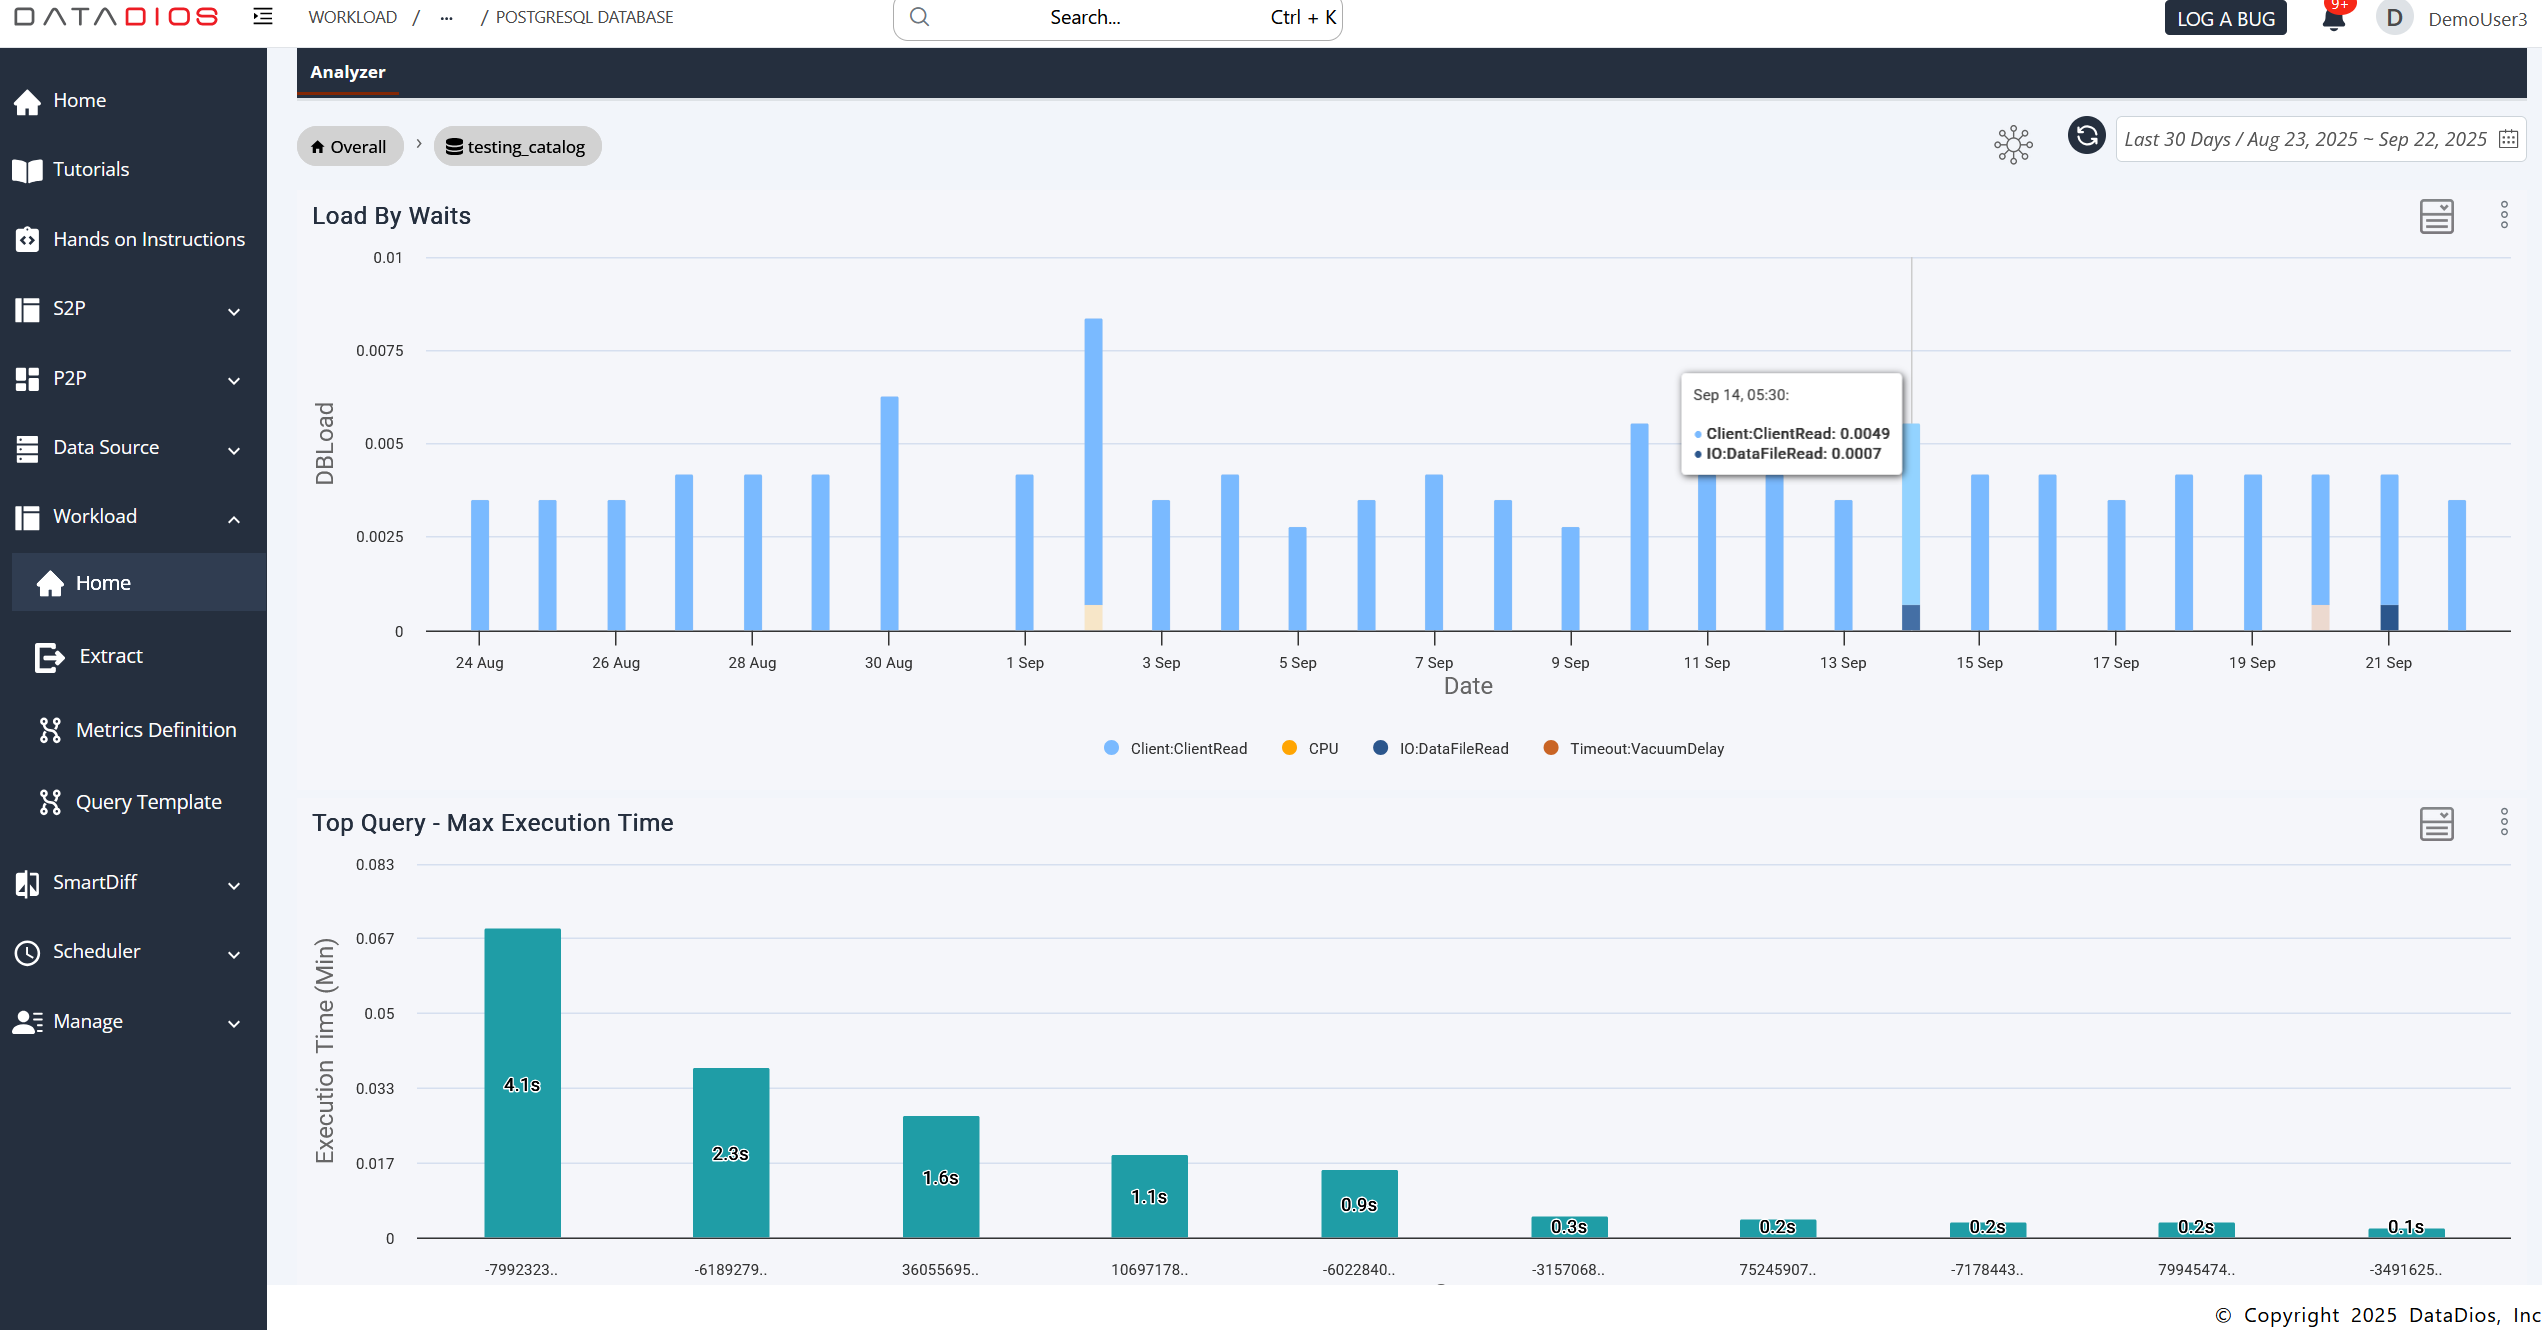
Some graphs have a drill-down feature, wherein you can view workload data in a particular context. For instance, you can view some of the graphs, that you see in the workload graphs in the context of a particular database.
- Click on the box menu icon in the top right corner of the top chart. Choose Load by Waits (Database) graph.
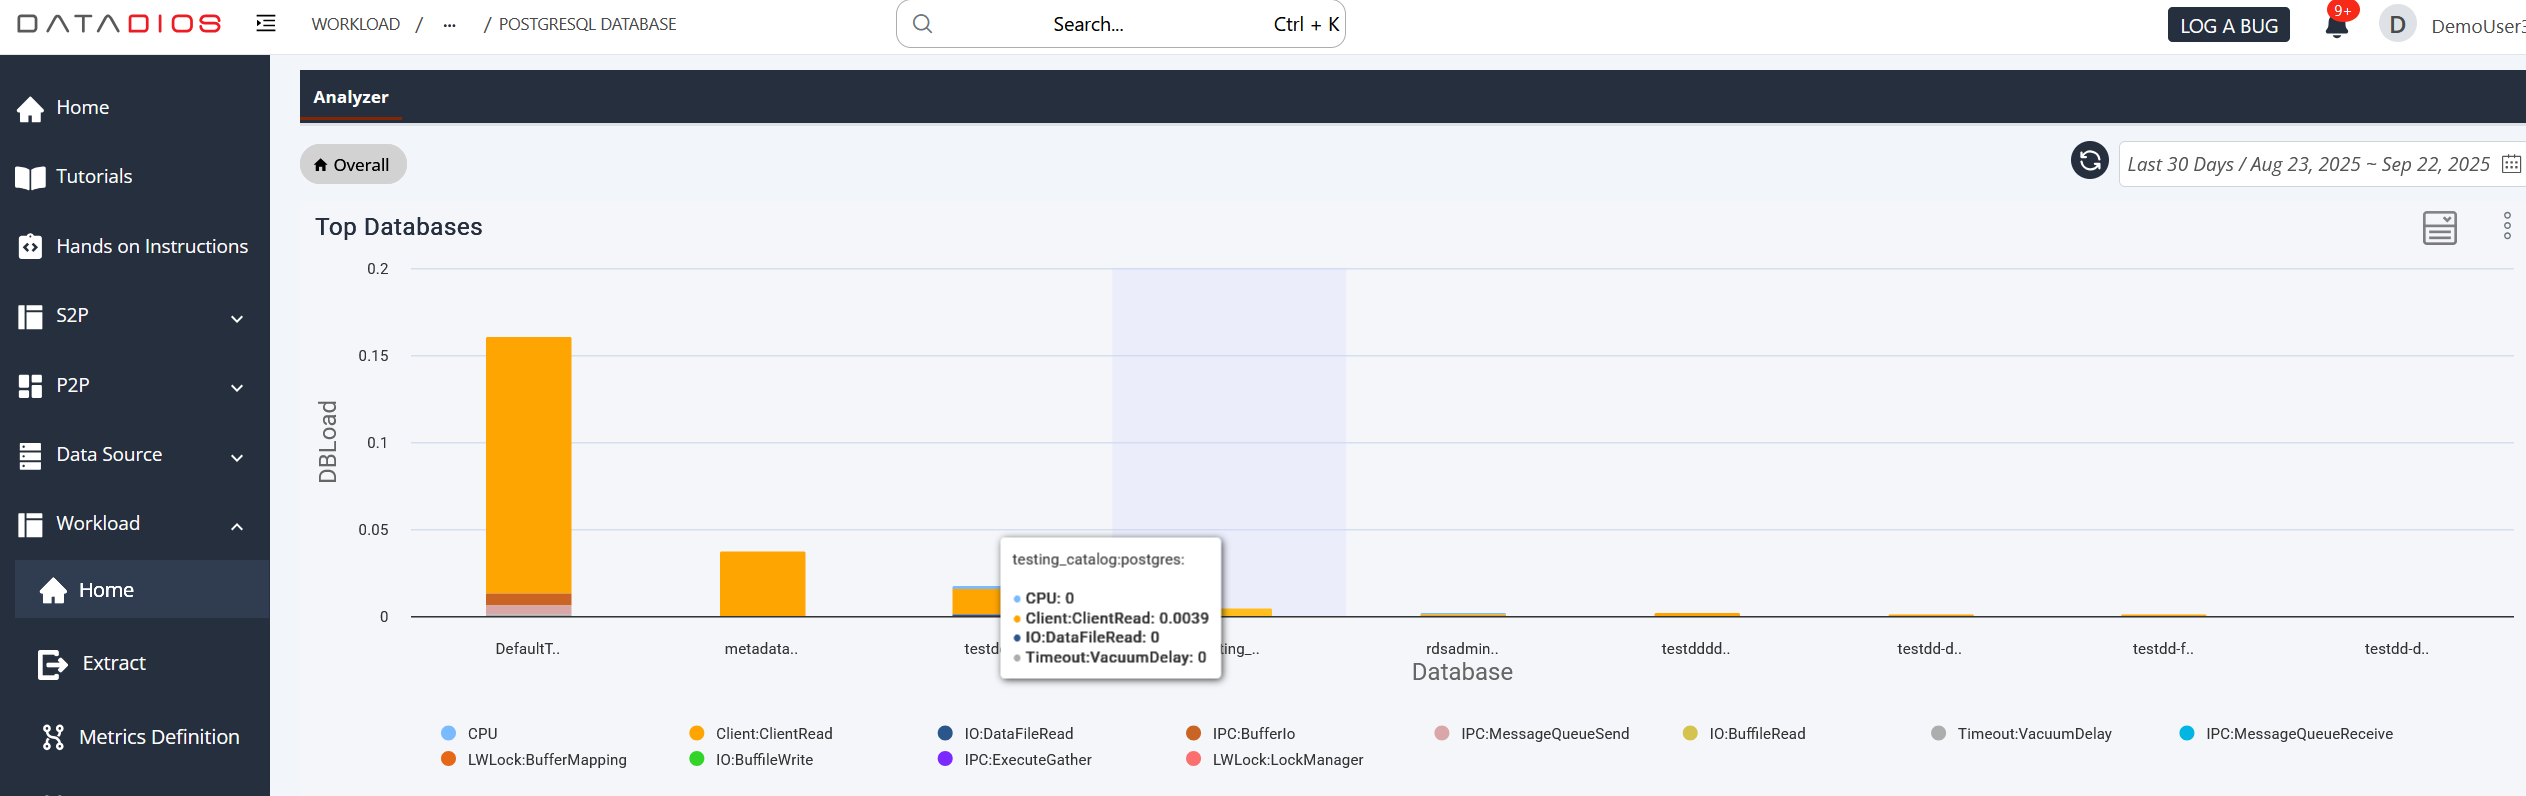
- Click on database testing_catalog.
- A new view will appear showing the graphs similar to the ones in the workload analyzer's main page.