Databricks
A Databricks Database data source connects DataDios to a Databricks workspace through one of its SQL warehouses. It reads the Unity Catalog tree — catalogs, schemas, tables and views — and, beside it, the workspace's jobs, pipelines, SQL warehouses and clusters.
A Databricks data source can be the source or target of a SmartDiff workflow. See SmartDiff on Databricks for three-part table names, the Unity Catalog grants a diff needs, and how a large table is batched.
Connect
-
Go to Data Explorer and click Add connection.
-
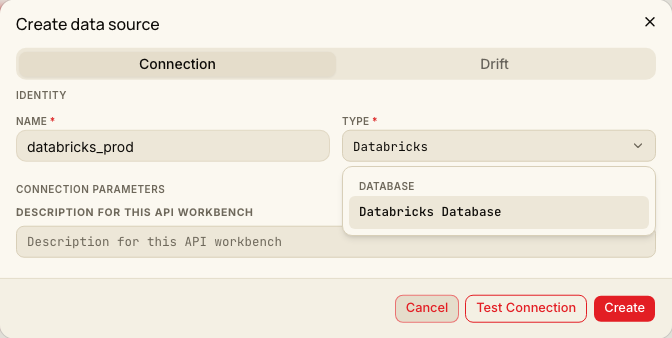
Enter a Name, and choose Databricks Database from the searchable Type list.
-
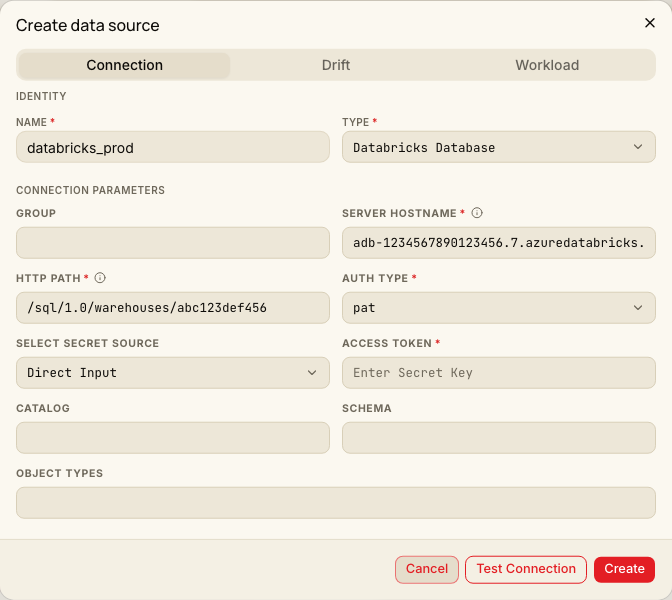
Fill in the connection:
| Field | What to enter |
|---|---|
| Group | Optional. A grouping label for data sources. |
| Server Hostname | The workspace host, for example adb-1234567890123456.7.azuredatabricks.net. |
| HTTP Path | The SQL warehouse's HTTP path, for example /sql/1.0/warehouses/abc123def456. |
| Auth Type | pat for a personal access token, or oauth_m2m for a service principal. |
| Select Secret Source | Where the access token or client secret comes from: Direct Input to type it here, or From Secret Store to reference a configured secret store. |
| Access Token | With pat: the personal access token. |
| Client ID / Client Secret | With oauth_m2m: the service principal's OAuth client ID and secret. |
| Catalog | Optional. Limit the catalog tree to these catalogs, comma-separated. |
| Schema | Optional. Limit the catalog tree to these schemas, comma-separated. |
| Object Types | Optional. List only these object types, comma-separated — for example TABLE,VIEW, or JOB,PIPELINE. Empty lists everything. |
Both Server Hostname and HTTP Path are shown on the SQL warehouse's Connection details tab in Databricks.
What you see in the Explorer
Workspace artifacts are available from the DataDios release after v1.13.0. Earlier versions list the catalog tree only.
Expand the data source and you see two groups:
- Catalogs — the Unity Catalog tree: catalogs, their schemas, and the tables and views in each.
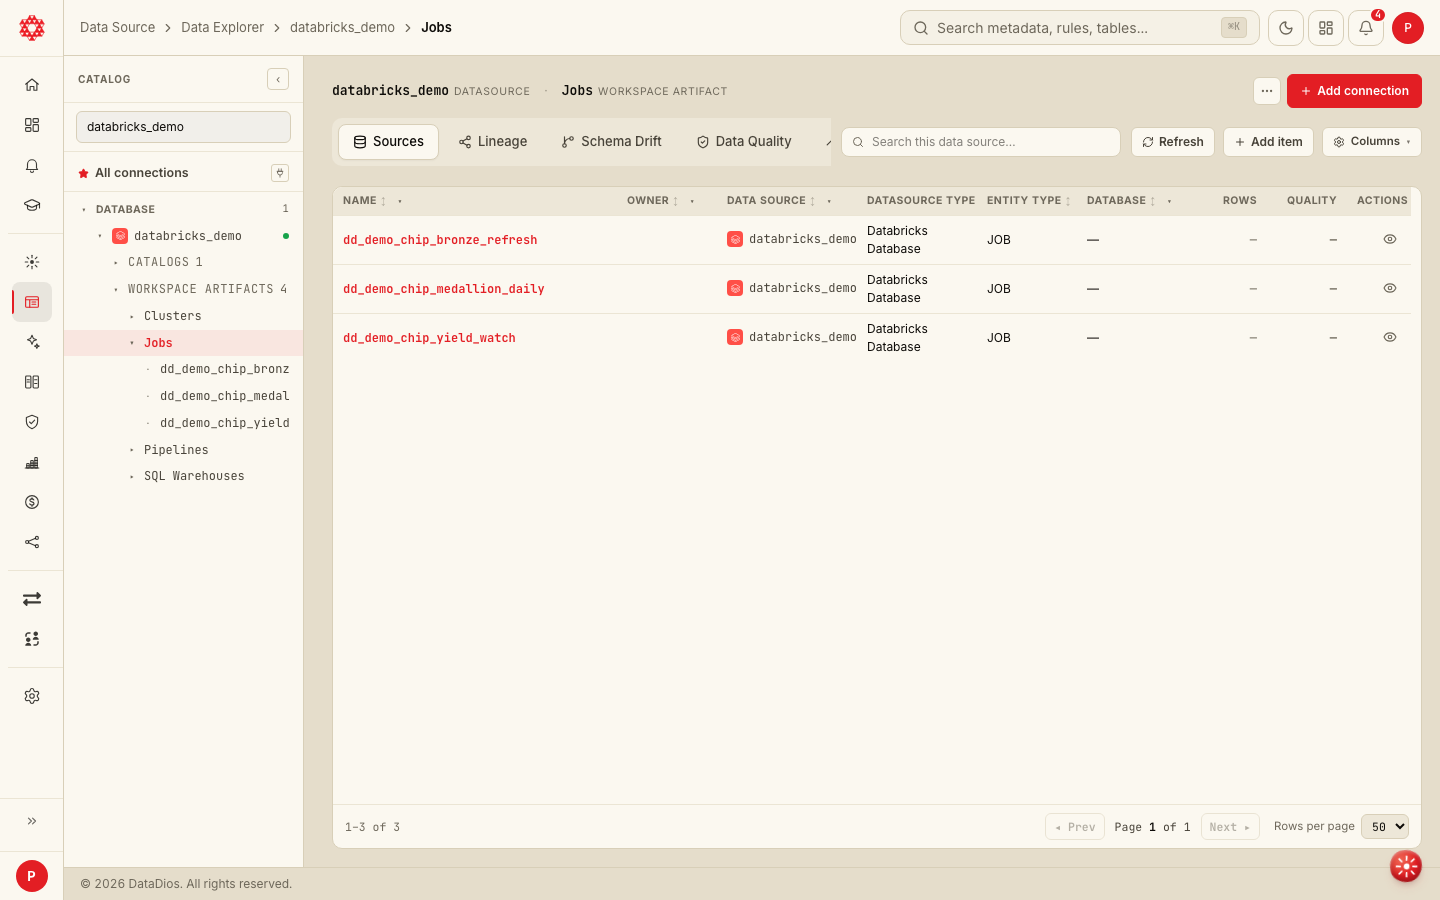
- Workspace Artifacts — one folder for each kind of workspace object:
| Folder | Holds | Object type |
|---|---|---|
| Jobs | The workspace's jobs, with their tasks. | JOB |
| Pipelines | Lakeflow (Delta Live Tables) pipelines. | PIPELINE |
| SQL Warehouses | The workspace's SQL warehouses. | SQL WAREHOUSE |
| Clusters | All-purpose clusters — the ones created in the Databricks UI or API. Job and pipeline clusters are created for each run and are not listed. | CLUSTER |
Only this workspace's objects are listed, even though Databricks keeps them for every workspace in the account's region. The Catalog and Schema fields limit the catalog tree only, not the artifacts.
Open a job, pipeline, warehouse or cluster to see what it is — its name, id, owner fields, tags and configuration (a job's task keys, a warehouse's size and type, a cluster's runtime and node types) — on the Metadata tab. They hold no rows, so Data Preview shows nothing for them.
Jobs, pipelines, warehouses and clusters take part in schema drift like tables do: an alert rule with An object is dropped (a table, a job, …) fires when one disappears, and Any schema change also reports additions, each named by type — for example "1 job(s) dropped". Changes to an existing job's settings are not tracked as drift.
Job runs, durations and cost are not objects. They are workload data: see Workload metrics for jobs, pipelines and SQL warehouses.
Create catalogs, schemas, tables and columns
Creating tables and columns works from the DataDios release after v1.13.0. In earlier versions, creating a table
or adding a column fails with a Databricks syntax error at NULL.
On the data source's row in Data Explorer, click Add item (the + button), or open a catalog or schema first so its name is filled in for you. In Create object in …, keep Create mode on Manual and choose an Object Type:
| Object Type | What it creates | Fields |
|---|---|---|
| CATALOG | A Unity Catalog catalog. | Object Name; optional Managed Location. |
| SCHEMA | A schema in a catalog. | Catalog, Object Name. |
| TABLE | A table with the columns you list. | Catalog, Schema, Object Name, Columns. |
| COLUMN | New columns on an existing table. | Catalog, Schema, Table, Columns. |
For each column, give a Column Name and a Column Type from the list. Column Length is for
VARCHAR and CHAR (255 when left empty) and for DECIMAL precision and scale, for example 10,2. Mark
Nullable for a column that may be empty, and Primary for one column that is the table's primary key.
Managed Location is the cloud storage path for the catalog's managed tables, for example
s3://bucket/path or abfss://container@account.dfs.core.windows.net/path. It must start with s3://,
s3a://, gs://, abfss:// or r2://, and may not contain spaces, quotes or a query string (?…). Leave it
empty to use the metastore's storage. A metastore without its own storage refuses a catalog that has no managed
location.
From SQL runs a CREATE statement you write yourself — use it for views and anything the form does not
offer.
What Databricks requires
The connection's user or service principal needs these Unity Catalog privileges:
| To create | Privileges |
|---|---|
| A catalog | CREATE CATALOG on the metastore. With a managed location, also CREATE MANAGED STORAGE on the external location that holds the path. |
| A schema | USE CATALOG and CREATE SCHEMA on the catalog. |
| A table | USE CATALOG on the catalog, and USE SCHEMA and CREATE TABLE on the schema. |
| Columns | MODIFY on the table. |
When Databricks refuses a create, DataDios shows Databricks' own reason, for example a missing privilege or a name that is already taken.
Limits
- New columns on an existing table must be nullable. Databricks does not allow adding a
NOT NULLcolumn to an existing table, so DataDios refuses the request before running it and names the columns to change. - A primary key column cannot be nullable, and only one column can be the primary key. Databricks treats
a primary key as information only and does not enforce it. Catalogs in
hive_metastoredo not support primary keys. - An existing name is not an error. Creating a catalog, schema or table whose name already exists leaves the existing one unchanged and reports success. The exception is a catalog with a Managed Location: Databricks refuses it when the name is taken, so the location is never silently ignored.
- Load Data and Create and Load write into tables with the
append,truncateorupsertwrite mode from a CSV file — see Load Data & Create Object. Loading needsUSE CATALOG,USE SCHEMA, andSELECTandMODIFYon the table. If the load in a Create and Load fails, the new table is kept, empty. - A load must finish within four minutes. Databricks writes a few hundred rows a second, and a load runs
inside one request. So DataDios estimates the time first, and refuses a file that would take longer, before
anything is written, with a message that gives the limit. Split the file and load the parts one after another.
Roughly, that is up to about 100,000 rows of 4 columns for
appendortruncate, and about 28,000 forupsert. Wider rows or long text values fit fewer.
Permissions for workspace artifacts
These grants apply from the DataDios release after v1.13.0, the first version that lists workspace artifacts.
DataDios reads the artifacts from Databricks system tables, over the same SQL warehouse connection. The user or service principal the connection signs in as needs:
USE CATALOGon thesystemcatalog;USE SCHEMAandSELECTonsystem.lakeflow(jobs and pipelines),system.compute(SQL warehouses and clusters) andsystem.access(DataDios finds this workspace insystem.access.workspaces_latest).
A Databricks account admin also has to enable those system schemas for the metastore. See Databricks' system tables documentation.
Without them, the catalog tree still syncs as before. The artifact folders stay, and their name says why they are empty and what to fix:
| Folder name | Meaning | What to do |
|---|---|---|
| Jobs (no access to system.lakeflow) | The connection cannot read that system schema: it lacks USE CATALOG on system, or USE SCHEMA or SELECT on the schema. Databricks reports all three the same way. | Grant USE CATALOG on system, and USE SCHEMA and SELECT on the schema. |
| Jobs (system.lakeflow not enabled) | The system schema is not enabled for this workspace. | Ask a Databricks account admin to enable it. |
| … (no access to system.access) on every folder | DataDios cannot look this workspace up. | Grant USE CATALOG on system, and USE SCHEMA and SELECT on system.access. |
| … (workspace not found) on every folder | This workspace's host is not in system.access.workspaces_latest. | Check Server Hostname. |
| Jobs (unavailable) | The table could not be read for another reason. | Ask your DataDios administrator to check the server log. |
A failure a retry can outlive is different: a connection timeout, a dropped or expired connection, a failed result download, or a query Databricks cancelled or ran out of resources for. The sync fails and is retried, as it would for any table, so nothing is recorded as removed. A query that runs past the SQL warehouse's own statement timeout is not retried: that kind shows (unavailable) like any other unreadable kind. Raise the warehouse's timeout to fix it. For every other reason above, the kind's objects are recorded as removed until DataDios can read them again.
Each kind is read on its own: without access to system.lakeflow, jobs and pipelines are empty but SQL
warehouses and clusters are still listed.
New or changed jobs can take a few minutes to appear — Databricks updates its system tables with a short delay.
Workload data by workspace
Workload data by workspace is available from the DataDios release after v1.13.0. Earlier versions collect the same rows without recording their workspace.
Databricks keeps query history, usage and cost in system tables that cover more than one workspace, and a Databricks data source collects all of it:
| Workload Analyzer tab | System table | Covers |
|---|---|---|
| Query Workload | system.query.history | every workspace in the account's cloud region |
| Compute Usage and Cost | system.billing.usage | every workspace in the account, in every region |
Each row records the workspace it came from, by name. DataDios reads the names from
system.access.workspaces_latest. When it cannot (the connection has no access to system.access, or a
workspace no longer exists there), the workspace is shown by its id. Usage that Databricks bills to the account
rather than to a workspace has no workspace.
Drill into one workspace. Each of these tabs has a chart with one bar per workspace:
| Tab | Chart | Shows per workspace |
|---|---|---|
| Query Workload | Query Time by Workspace | total query duration |
| Compute Usage | DBUs by Workspace | DBUs used |
| Cost | Cost by Workspace | cost in USD |
Click a bar to see the tab's charts for that workspace only. The breadcrumb shows the workspace's name; click the data source's name in it to go back.
- Turn workload on for one Databricks data source per account. Two data sources connected to workspaces in the same account collect the same rows, so their charts repeat each other and the Cost Dashboard adds the account's cost twice.
- Bars follow the name. A workspace renamed during the selected period shows as two bars, one per name. Two
workspaces with the same name keep separate bars: each name is followed by the workspace ID, for example
dev (1234567890123456). - Storage has no workspace. The Storage tab reads
system.storage.table_metrics_history, which is kept per Unity Catalog metastore, and a metastore is shared by the workspaces attached to it. - Rows collected before this release have no workspace. They still count on the tab's other charts, but not in the by-workspace charts, so their bars can add up to less until those rows age out. Usage billed to the account is left out of those charts too.
Job and pipeline lineage
Job and pipeline lineage is available from the DataDios release after v1.13.0.
When this data source is a member of a lineage workspace, each job and pipeline the Explorer lists appears on the
lineage canvas between the tables it read and the tables it wrote. DataDios reads this from the
system.access.table_lineage system table, which Databricks fills in as the jobs run.
- Last 90 days. Only reads and writes recorded in the last 90 days are used. A job that stopped running keeps its edges until its last recorded run is more than 90 days old.
- Which jobs. Only jobs and pipelines the Explorer lists get a node, so Object Types decides: leave out
JOBorPIPELINEand they get no lineage. A deleted job's recorded runs are ignored. - Which tables. A job is joined to each table it read and each table it wrote. A table-to-table edge joins a
table the job read to one it wrote only where Databricks recorded the two together. A table the job reads back
after writing it (a
MERGEreads its own target) is shown only as written. Tables must be tables this data source lists, matched on all three parts ofcatalog.schema.table. A table in another data source, or outside this source's Catalog and Schema fields, is left out. - Observed, not declared. These edges are marked Discovered: Databricks saw the job read and write those tables. They are never shown as Declared.
- Permissions. Lineage needs
USE CATALOGonsystem,USE SCHEMAandSELECTonsystem.access, and thesystem.accessschema enabled — the same grant as in Permissions for workspace artifacts. - Warehouse use. Every lineage build of the workspace reads the last 90 days of
system.access.table_lineagethrough this connection's SQL warehouse, which starts the warehouse if it is stopped. To turn it off, see Which jobs above.
If the lineage cannot be read — no access to system.access, the schema not enabled, the warehouse did not
answer, or the query did not finish within 60 minutes (it is then cancelled) — the source's tables still build, and
the job edges from the last successful build are kept. The workspace still shows as built: the reason is recorded
with the build and in the server log, and the lineage page does not show it yet.
Workload metrics for jobs, pipelines and SQL warehouses
The Pipelines and Warehouses tabs, the by Workspace charts on the Jobs, Pipelines and Warehouses tabs, and job runs counted once per run are available from the DataDios release after v1.13.0.
When this data source's workload is extracted, the Workload Analyzer shows three tabs for Databricks work, beside the query, compute, storage and cost tabs:
| Tab | Chart | What it shows |
|---|---|---|
| Jobs | Daily Job Runs by Result State | How many job runs ended each day, by result (SUCCEEDED, FAILED, …). |
| Top Jobs by Run Duration | The longest runs: job id, run id, duration, result and run type. | |
| Job Runs by Workspace | Runs per Databricks workspace, up to ten. Click a bar to see the tab's charts for that workspace only. | |
| Pipelines | Daily Pipeline Updates by Result State | How many pipeline updates ended each day, by result (COMPLETED, FAILED, …). |
| Slowest Pipeline Updates | The longest updates: pipeline id, update id, duration, result, update type and trigger. | |
| Pipeline Updates by Workspace | Updates per workspace, up to ten. Click a bar to see the tab's charts for that workspace only. | |
| Warehouses | Peak Warehouse Clusters per Hour | For each SQL warehouse, the most clusters it ran in each hour that had a start, stop or scaling event. It counts the clusters a warehouse was already running when the hour began, read back up to a day before the chart's range. Hours with no event have no point. Up to ten warehouses are shown: those that reached the most clusters, and among warehouses that reached the same number, those with the most events. |
| Daily Warehouse Events by Type | How many times each day the warehouses started, ran, scaled up or down, and stopped. | |
| Warehouse Events by Workspace | Events per workspace, up to ten. Click a bar to see the tab's charts for that workspace only. |
How runs are counted:
- One run, one row. Databricks records a long job run or pipeline update as several rows, one per hour. DataDios counts it once, with its whole duration — from when it started to when it ended — and the result of its last row. Before this release, a run longer than an hour was counted once for every hour it touched, and its duration was that hour's only. Runs collected before you upgrade keep the old counting, and a run that started before the upgrade and ended after it is counted once more, whole, on the day it ended.
- Counted on the day it ended. A run is collected on the day it finished. A run still going when the workload is extracted is collected with the day it ends, never counted twice. A continuous pipeline appears only once it stops.
- Runs longer than 30 days show their duration from 30 days before the day they ended.
- Late rows. Databricks fills its system tables with a delay. A run whose last row, or a warehouse event, arrives after that day's workload was extracted is not collected.
Workspaces
Job runs, pipeline updates and warehouse events are kept for every workspace in the account, and each row records its workspace, by name — the same as in Workload data by workspace, whose notes apply here too: turn workload on for one Databricks data source per account, and a renamed workspace shows as two bars. Job runs collected before this release have no workspace, so Job Runs by Workspace can add up to less than Daily Job Runs by Result State until they age out.
Permissions
These charts read system.lakeflow.job_run_timeline, system.lakeflow.pipeline_update_timeline and
system.compute.warehouse_events. They need the same grants as the
workspace artifacts: USE CATALOG on system, and USE SCHEMA and
SELECT on system.lakeflow and system.compute. Workspace names come from system.access; without it the
charts still work and show workspace ids.