DataDios Performance Analyzer
Overview
DataDios Performance Analyzer is a powerful tool designed to analyze and optimize workloads across various cloud and on-prem platforms such as databases, data governance tools, models, and cloud compute infrastructure. It provides deep visibility into resource utilization, execution performance metrics, and cost efficiency, enabling organizations to make informed decisions about their infrastructure.
Video Demonstration
Watch the complete overview walkthrough of Performance Analyzer in action:
Key Features
Comprehensive Workload Analysis
Performance Analyzer offers detailed analysis of workloads, including CPU, storage, wait events, and cost trends. It helps:
- Identify underutilized resources
- Identify potential performance bottlenecks
- Fine-tune work units and utilization
Considering a database as a data source for workload analysis, the tool helps with:
- Analyzing query performance
- Indexing efficiency
- Long executing queries
- IO and storage usage
- Identifying relations between queries and underlying tables or views
Multi-Cloud Support
The tool supports multiple cloud platforms, including AWS, IBM Watsonx, IBM WKC, private clouds, and on-prem environments. This ensures that organizations can analyze workloads across their entire infrastructure.
Supported Data Source Types
Performance Analyzer can run against the following data source types:
- Oracle Database
- Snowflake Database
- PostgreSQL Database
- Watsonx.data
- Trino Engine
- MySQL Database
- OpenAI Model
- Ollama Model
- AWS Service
- Hetzner Cloud
- Azure Service
- Remote Host
- Cost Dashboard
- DataDios
- SQLServer Database
Hetzner Cloud Workload
A Hetzner Cloud data source can collect two workflows: Hetzner Cost Workload (daily), an estimate of cost per service type, and Hetzner Inventory Workload (hourly), which shows how many servers, volumes and load balancers the project has, how many servers are not running, and how many volumes are not attached to a server.
The inventory shows the latest hourly snapshot rather than a full history, and it leaves out Robot (dedicated) servers, floating IPs and networks. See Hetzner Cloud for the charts and what they leave out.
PGMQ Queue Workload (PostgreSQL)
A PostgreSQL Database data source can collect PGMQ Queue Workload, which shows how backed up the PGMQ message queues on the server are. It is collected once a day and shown on the Queues tab of the PostgreSQL workload page, with one series per queue and database:
- Queue depth: the number of messages waiting in each queue.
- Oldest message age: how long the oldest waiting message has been in the queue, in seconds.
Things to know:
- It needs the
pgmqextension. Databases on the server without it are skipped, and the run still succeeds. If no database haspgmq, the charts are empty. - It connects to each database on the server once per run, because queues are stored per database.
- Like the other PostgreSQL workflows, it is enabled by default when workload analysis is turned on. Uncheck PGMQ Queue Workload in the workflow list to exclude it.
Cost Optimization
Performance Analyzer provides insights into cost efficiency by identifying idle resources. If the analyzer indicates lower workload usage, responsible individuals in the organization may choose to lower the resources of the data sources thereby reducing the operating costs while maintaining reasonable performance.
User-Friendly Interface
Performance Analyzer features an intuitive graphical interface that simplifies the analysis process. Users can easily navigate through various metrics, query performance, query plans, storage usage, execution time, IO, and visual dependency graphs.
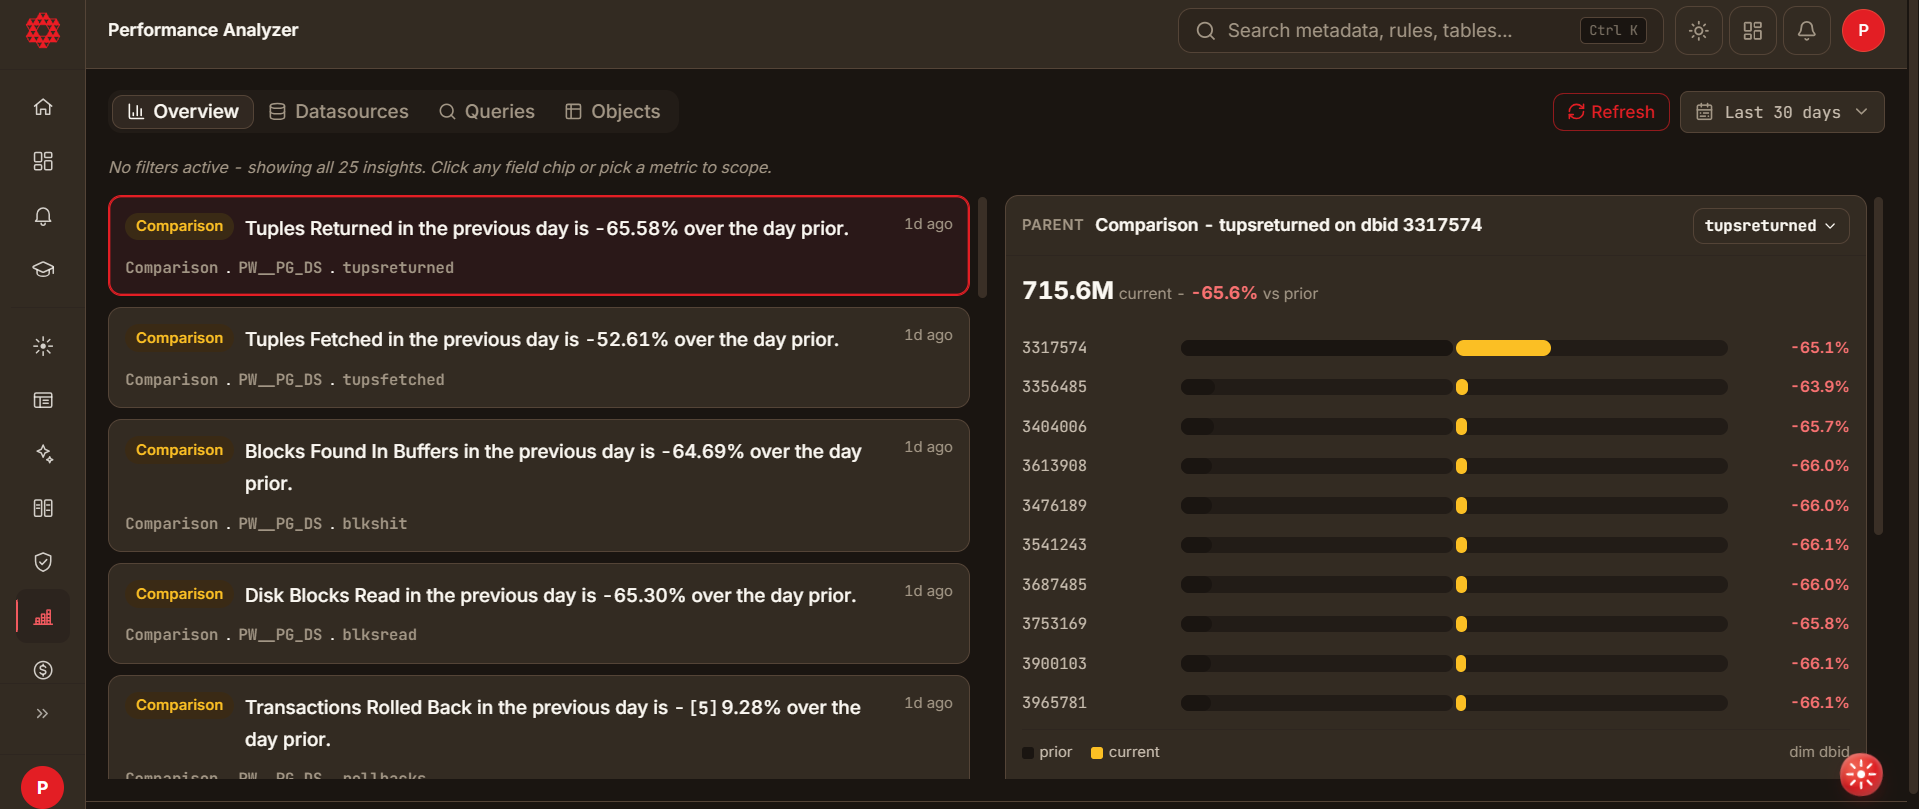
Module Overview
Performance Analyzer is organized into key areas:
| Module / Tab | Description |
|---|---|
| Overview | Landing view displaying automated insight feed cards (TopN, Comparison, Forecast, Anomaly, Association). |
| Datasources | Lists all registered data sources enabled for workload extraction with status and record counts. |
| Performance Dashboard | Interactive workload dashboard charts for a data source, with date range controls, metric selectors, and per-chart actions. |
| Queries & Objects | Searchable metrics browsers for queries and database objects with query text and plan inspection. |
| Drill-down Graphs | Bar-per-database drill-down view to reload database-scoped chart dashboards. |
| Dependency Graphs | Hot Edges table and Neighborhood visual graph showing query-to-table relationships. |
| PostgreSQL Workload Graphs | Reference guide for PostgreSQL metrics, CPU load, and wait event charts. |
| MySQL Workload Graphs | Reference guide for MySQL metrics, CPU count, and IO activity charts. |