Dependency Graphs
The Dependency Graph displays execution relationships between SQL queries and their underlying database assets (tables and views), helping teams trace data lineage, analyze query impact, and prevent breaking schema changes.
Accessing Dependency Graphs
- Perform Database Drill-Down: Follow the drill-down procedure to land on a database-scoped Performance Analyzer dashboard page.
- Automatic Section Rendering: Scroll down past the main workload charts. The Dependency graph section appears automatically on the page — no additional navigation or manual click is required.
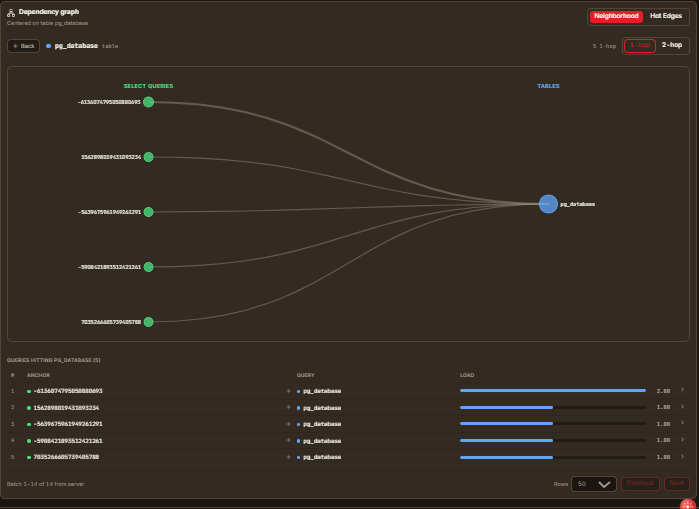
Dependency Graph Modes & Features
1. Hot Edges Mode (Default View)
When you scroll down to the Dependency graph section, it opens in Hot Edges mode by default:
- Ranked Lists: Displays two side-by-side ranked lists:
- Hot Tables: Tables experiencing the highest query interaction frequency.
- Hot Queries: Queries hitting the most underlying database objects.
- Relationship Table: A comprehensive table listing
query → tablerelationships along with execution load indicators. - Query Filter: Use the ALL, SELECT, or DML filter buttons to restrict the view to read-only queries or write operations (
INSERT,UPDATE,DELETE).
2. Neighborhood Visual Graph Mode
Click any table or query entry in the Hot Edges table to anchor on that asset. The view instantly switches to the Neighborhood interactive visual graph:
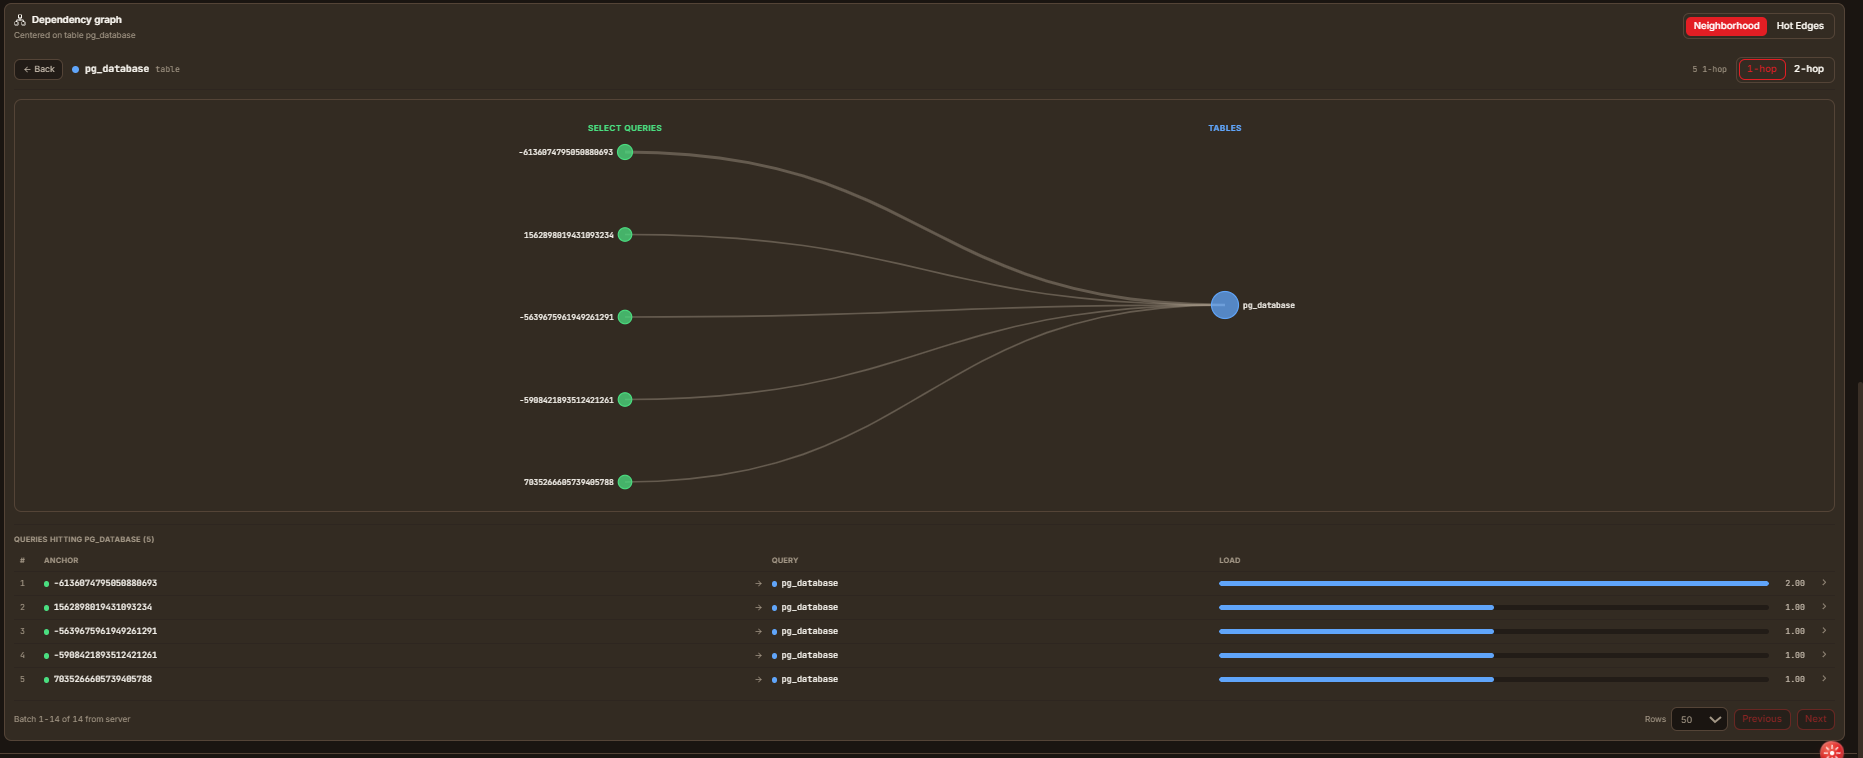
- Centered Node Anchor: The visual canvas centers around your selected asset (e.g.,
pg_databasetable). - Connected Query Nodes: Color-coded circles represent connected queries:
- 🟢 Green Node: Regular /
SELECTquery. - 🟠 Orange Node:
DMLquery (INSERT,UPDATE,DELETE). - 🔵 Blue Node: Database Table or View asset.
- 🟢 Green Node: Regular /
- Hover Details: Hover over any circle node to inspect the complete query text or full table path.
- 1-Hop / 2-Hop Depth Controls: Toggle between 1-hop (direct 1st-level query dependencies) and 2-hop (extended 2nd-level indirect dependencies).
- Queries Hitting Asset List: Below the graph, a detailed table lists every query hitting the anchored asset, complete with execution load bars.
- Back Button: Click the ← Back button at the top left of the graph header to return to the default Hot Edges view.