Landing On The Page
Navigating to Performance Analyzer
- Open the left sidebar navigation in DataDios (
dd-ui). - Under Products, click on Performance Analyzer.
- The main Performance Analyzer dashboard opens with top-level navigation tabs: Overview, Datasources, Queries, and Objects.
Performance Analyzer Tabs
1. Overview Tab
The Overview tab serves as the primary landing feed, surfacing automatically generated workload insights:
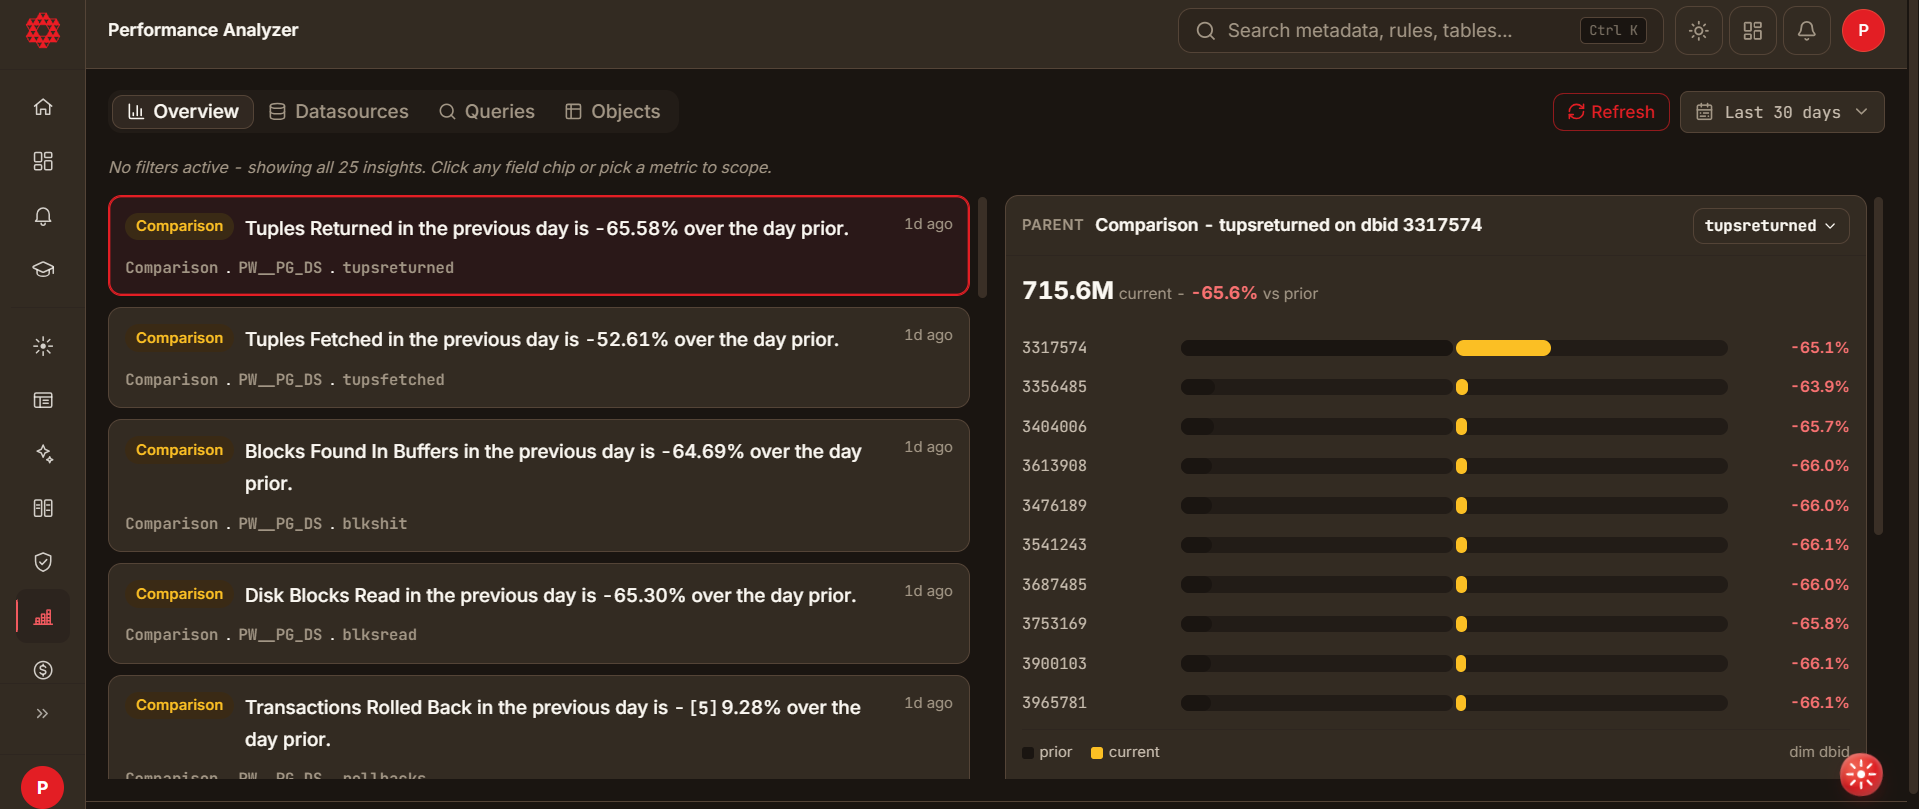
- Insight Feed Cards: Displays insights classified into TopN, Comparison, Forecast, Anomaly, and Association.
- Parent Insight Detail: Selecting any insight card opens a detailed breakdown showing target databases, metric values, and percentage deltas.
- Drill Links: Click on any insight card chip or Drill into: Workload – [source] to navigate directly to that data source's workload dashboard.
- Add to Dashboard: The Parent Insight Detail panel and the drill view each include a chart actions menu with an Add to dashboard option, letting you pin that insight to a custom dashboard the same way as any other chart. See Performance Dashboard & Charts for how a pinned insight tile behaves.
2. Datasources Tab
The Datasources tab lists all connected data sources configured for workload extraction:
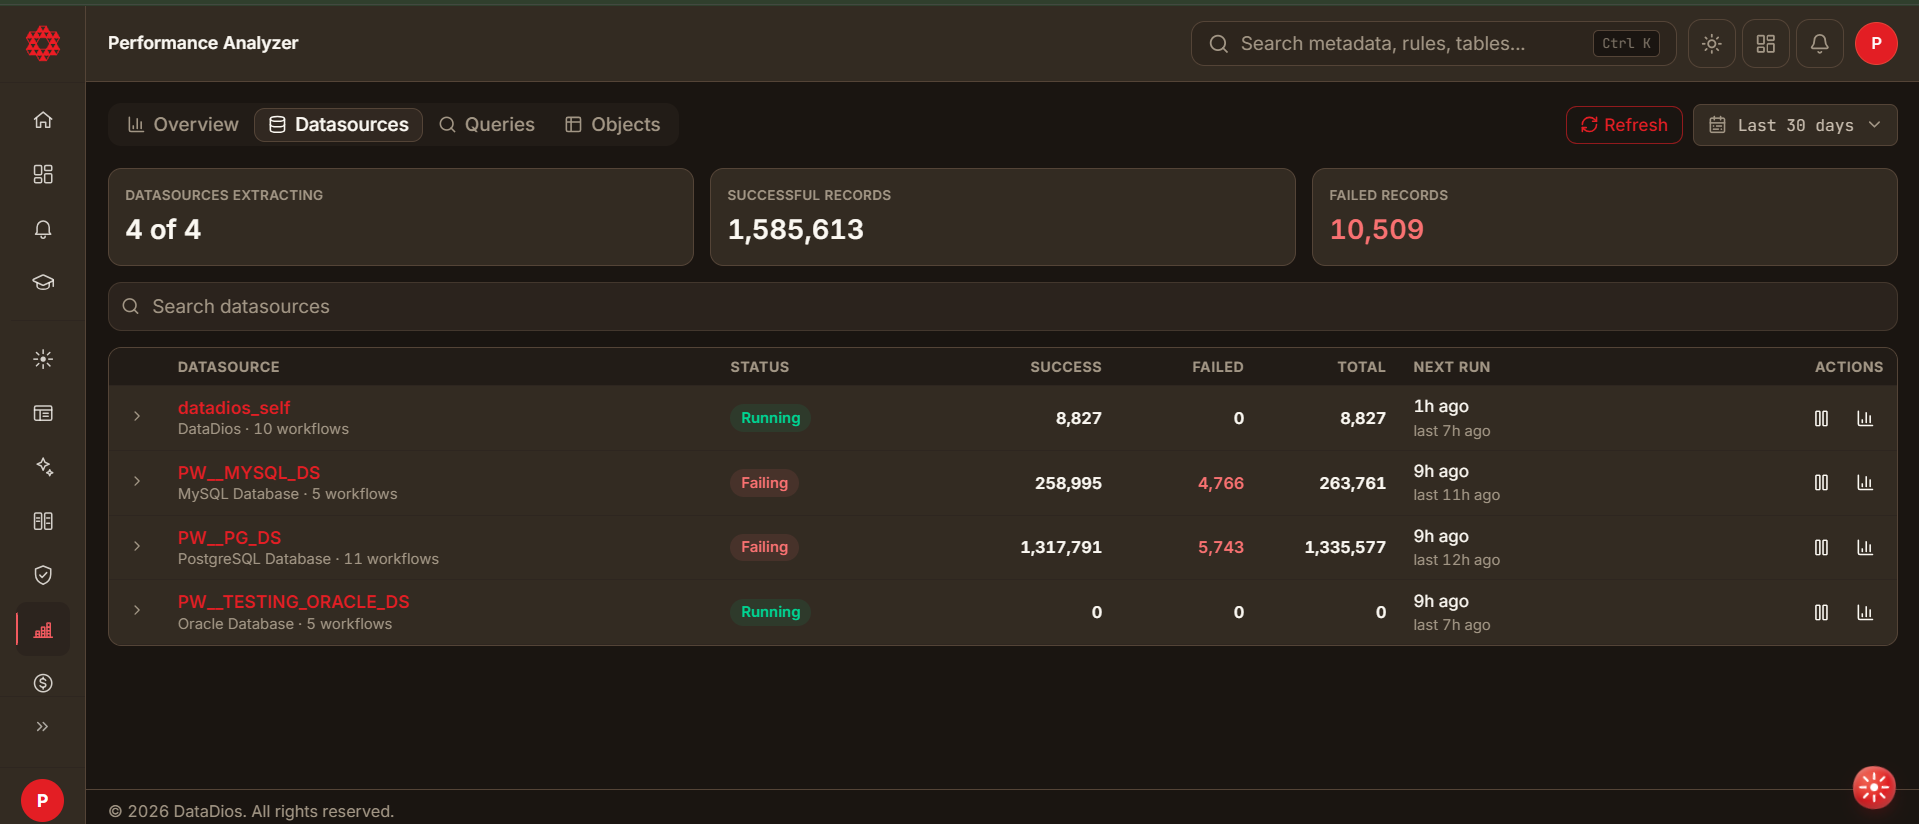
- Extraction Summary: Displays active data sources (e.g.,
4 of 4), total successful extraction records, and failed record counts. - Datasource List: Shows each data source name, engine type, extraction status (
Running/Failing), success/failed record tallies, and next extraction run schedule. - Action Buttons: Pause/Resume extraction or jump directly to workload analysis charts (
📊).
3. Queries Tab
The Queries tab provides a central inventory of all queries captured across workloads:
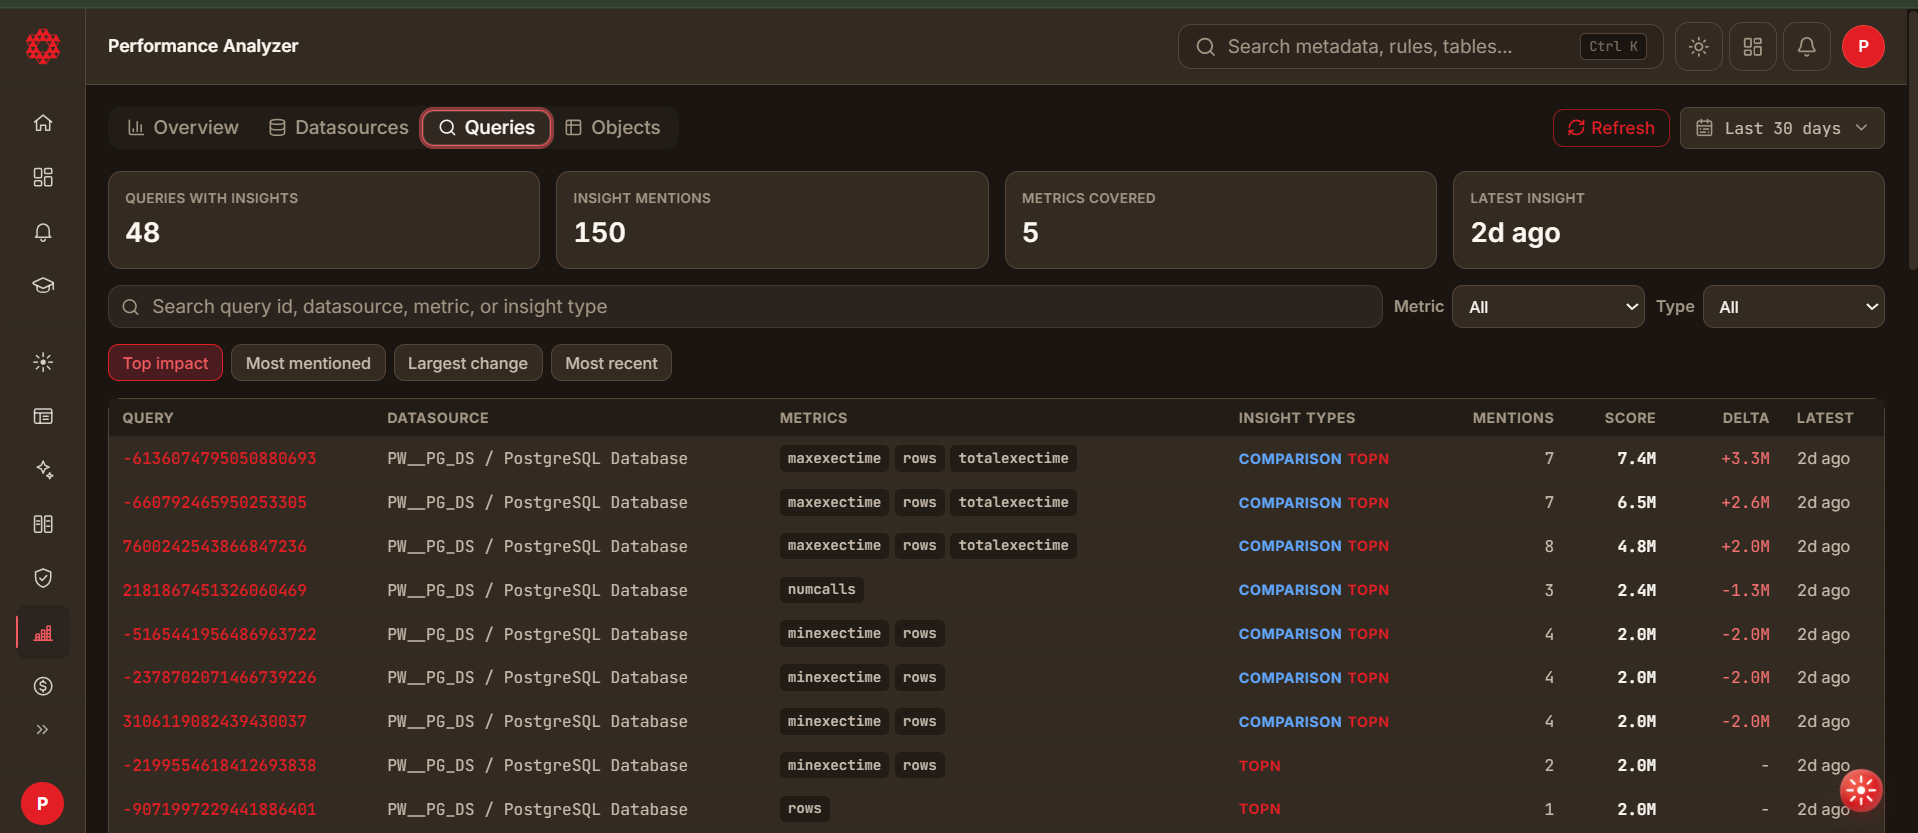
- Summary cards for Queries with Insights, Insight Mentions, Metrics Covered, and Latest Insight.
- Preset sort filters: Top impact, Most mentioned, Largest change, and Most recent.
- Click any Query ID to open full syntax-highlighted SQL text and Query Plans.
4. Objects Tab
The Objects tab indexes database tables, views, and schemas:
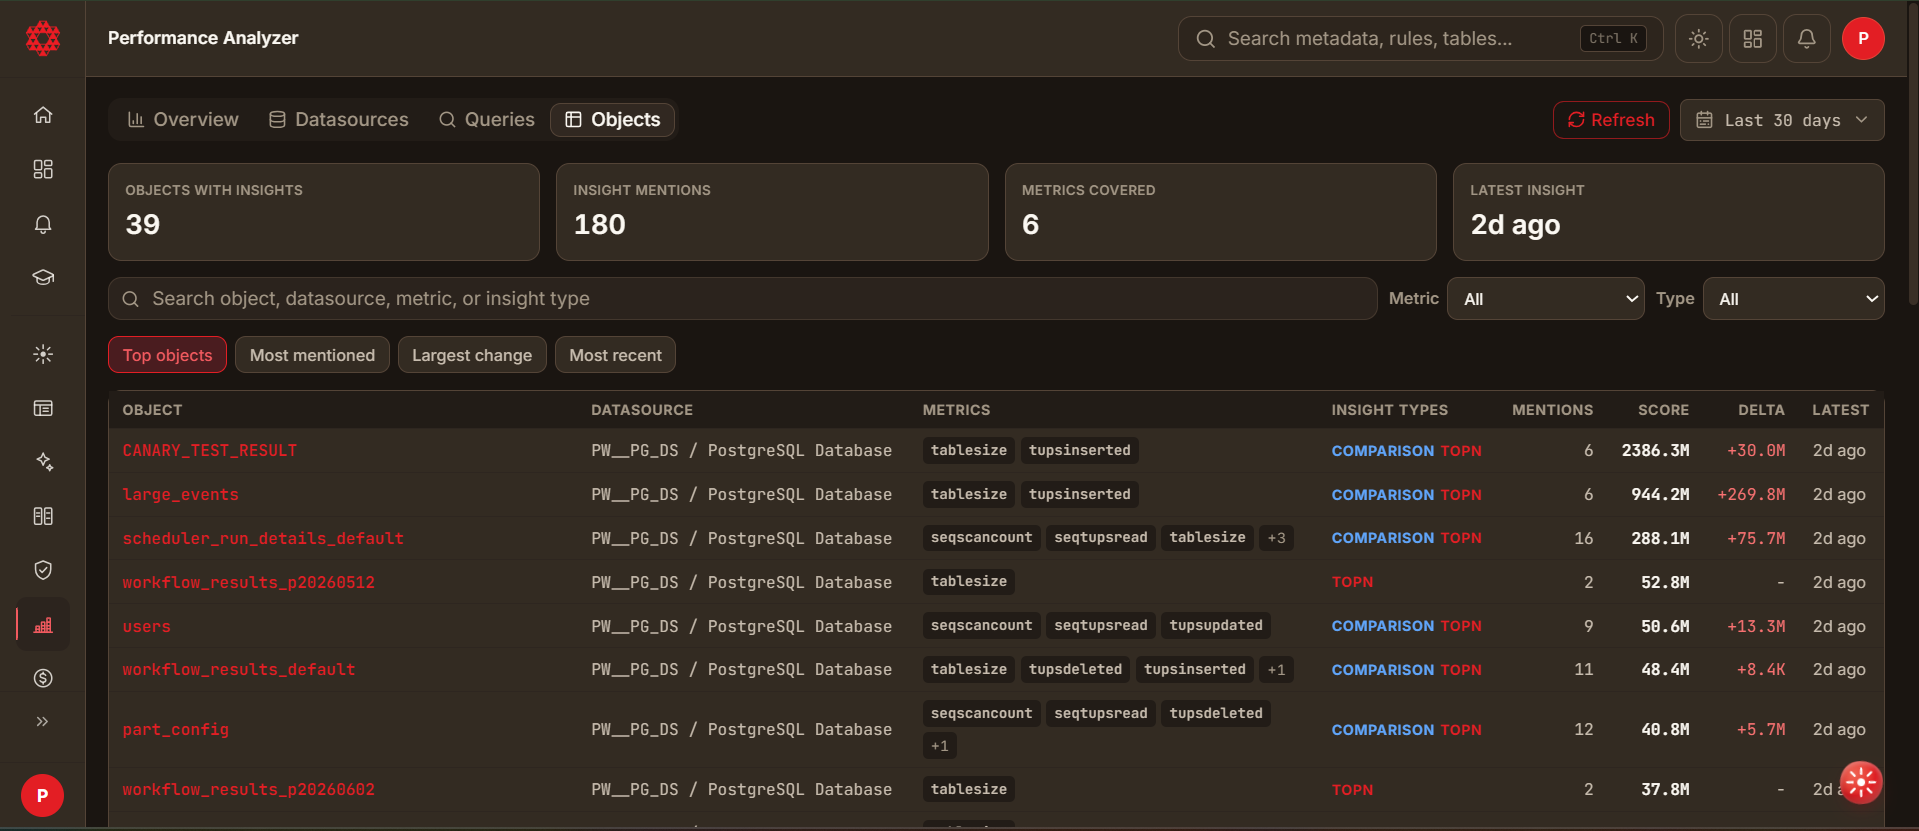
- Summary statistics and searchable index of database objects linked to workload metrics (e.g.
tablesize,tupsinserted,seqscancount).
Date Range Selector & Controls
Date Range Selector
- In the top right corner of the Performance Analyzer view, a Date Range Selector control is visible (e.g.,
Last 30 days). - Click on it to expand pre-determined date range options:
- Last 1 Hour
- Last 12 Hours
- Last 24 Hours
- Today
- Yesterday
- Last 7 Days
- Last 30 Days
- Last 90 Days
- Custom Calendar Range
- Selecting a time range refreshes the dashboard view to fetch and display metrics for that specific period.
Refresh Data Button
- Click the Refresh Data button located adjacent to the date range selector to fetch the latest telemetry immediately.
Chart Action Menu
- Each individual chart features a 3-dot action menu (
⋮) in its top right corner:- Create Alert: Set up threshold alerts on the metric.
- Pin to Dashboard: Add the chart to a custom monitoring dashboard.
- Export Image: Download the chart as a PNG or PDF report.
Metrics Definition & Query Template Editors
Two additional controls — Metrics Definition and Query Template — appear in the Performance Analyzer header, next to the date range selector and Refresh button. They are not shown on a single query's detail view opened from the Queries tab, where a Back to queries control takes their place.
Both buttons are visible to an Admin or Privileged user of the default tenant. Any other signed-in user — including an admin of a non-default tenant — will not see them.
Saving is narrower than viewing. Only an Admin can save. A Privileged default-tenant user sees both buttons and can open and read the JSON, but SAVE CHANGES returns User not allowed to this operation.
Metrics Definition
Opens a JSON editor listing the metric groups DataDios extracts for workload monitoring, grouped by data source type (PostgreSQL, Snowflake, MySQL, etc.).
- The data source types are listed as chips on the right, grouped by category. Only types that support workload collection appear — not every data source type in DataDios is listed.
- The first available type is selected automatically, so its JSON is already loaded when the editor opens. Click another chip to switch types.
- Use the download icon next to the title to save a copy of the current JSON before you edit it.
- Edit the JSON directly in the code editor and click SAVE CHANGES to apply it.
- Impact: a saved change applies to every data source of that type in this DataDios installation, across every tenant — not just the one you were viewing when you opened the editor. It controls what workload extraction collects going forward.
Query Template
Opens a JSON editor listing the SQL query templates and dashboard tab/graph structure Performance Analyzer uses to build each data source type's dashboards, drilldowns, and query-detail views.
- The chips, automatic first selection, and download icon work the same way as in the Metrics Definition editor.
- Edit the JSON directly in the code editor and click SAVE CHANGES to apply it.
- Impact: a saved change reshapes the dashboards and drilldowns for every data source of that type in this DataDios installation, across every tenant — including which queries run to populate charts. Treat this as a schema change, not a display tweak.
These definitions are stored per data source type, not per tenant. A bad edit changes workload collection or dashboard structure for every data source of that type in the installation — switching to another tenant does not isolate it.
Download the current JSON first so you can restore it, and validate an unfamiliar change in a separate DataDios environment before saving it here.