Drill-down Graphs
Some graphs in Performance Analyzer have a drill-down feature, allowing you to isolate and view workload telemetry within the specific context of a single database.
Step-by-Step Database Drill-down Procedure
Follow these exact steps to trigger a database-scoped drill-down view:
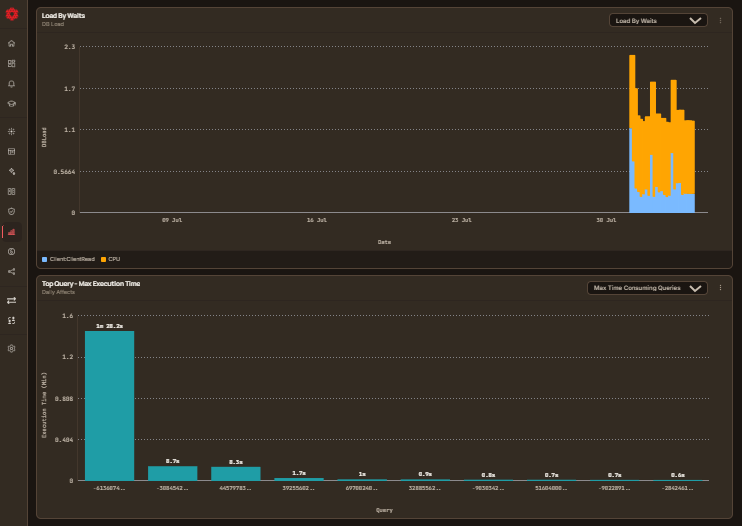
- Open Performance Analyzer: Navigate to Performance Analyzer in the left sidebar. Go to the Overview, Queries, or Objects tab and click into a data source (or click Drill into: Workload – [source] from an insight card) to open its dashboard.
-
Select the Database Metric Variant: On the dashboard's Analyzer tab, locate the metric dropdown selector on the top chart (which defaults to a metric like Load By Waits). Click the dropdown and select the (Database) variant — e.g., Load By Waits (Database).
-
View Top Databases Chart: The chart instantly re-renders as a bar-per-database view titled Top Databases, displaying execution load broken down across databases.
-
Trigger Database Drill-Down: Click directly on the bar corresponding to the database you want to inspect (e.g.,
postgresortesting_catalog). -
Database-Scoped Dashboard Reload: This action triggers the database drill-down. The page URL updates to a database-scoped route and reloads, displaying charts and metrics isolated strictly to that chosen database.
Metric Dropdown Selector
You can dynamically switch the top chart metric at any time using the metric dropdown in the top right corner of the chart:
- Load By Waits: Overall database load broken down by wait events (CPU, ClientRead, IO, etc.).
- Load By Waits (Database): Load aggregated per database (drill-down trigger view).
- Load By Waits (Host): Load broken down by client IP or host machine.
- Load By Waits (BackendType): Load broken down by backend worker type.
- Load By Waits (Application): Load broken down by connecting application name.
- Load By Waits (User): Load broken down by database user account.
- Load By Waits (Query): Load broken down by query hash / SQL ID.