Queries and Objects Browsers
Performance Analyzer provides dedicated metrics browsers for searching, filtering, and deeply inspecting database queries and objects across your workloads.
Queries Browser
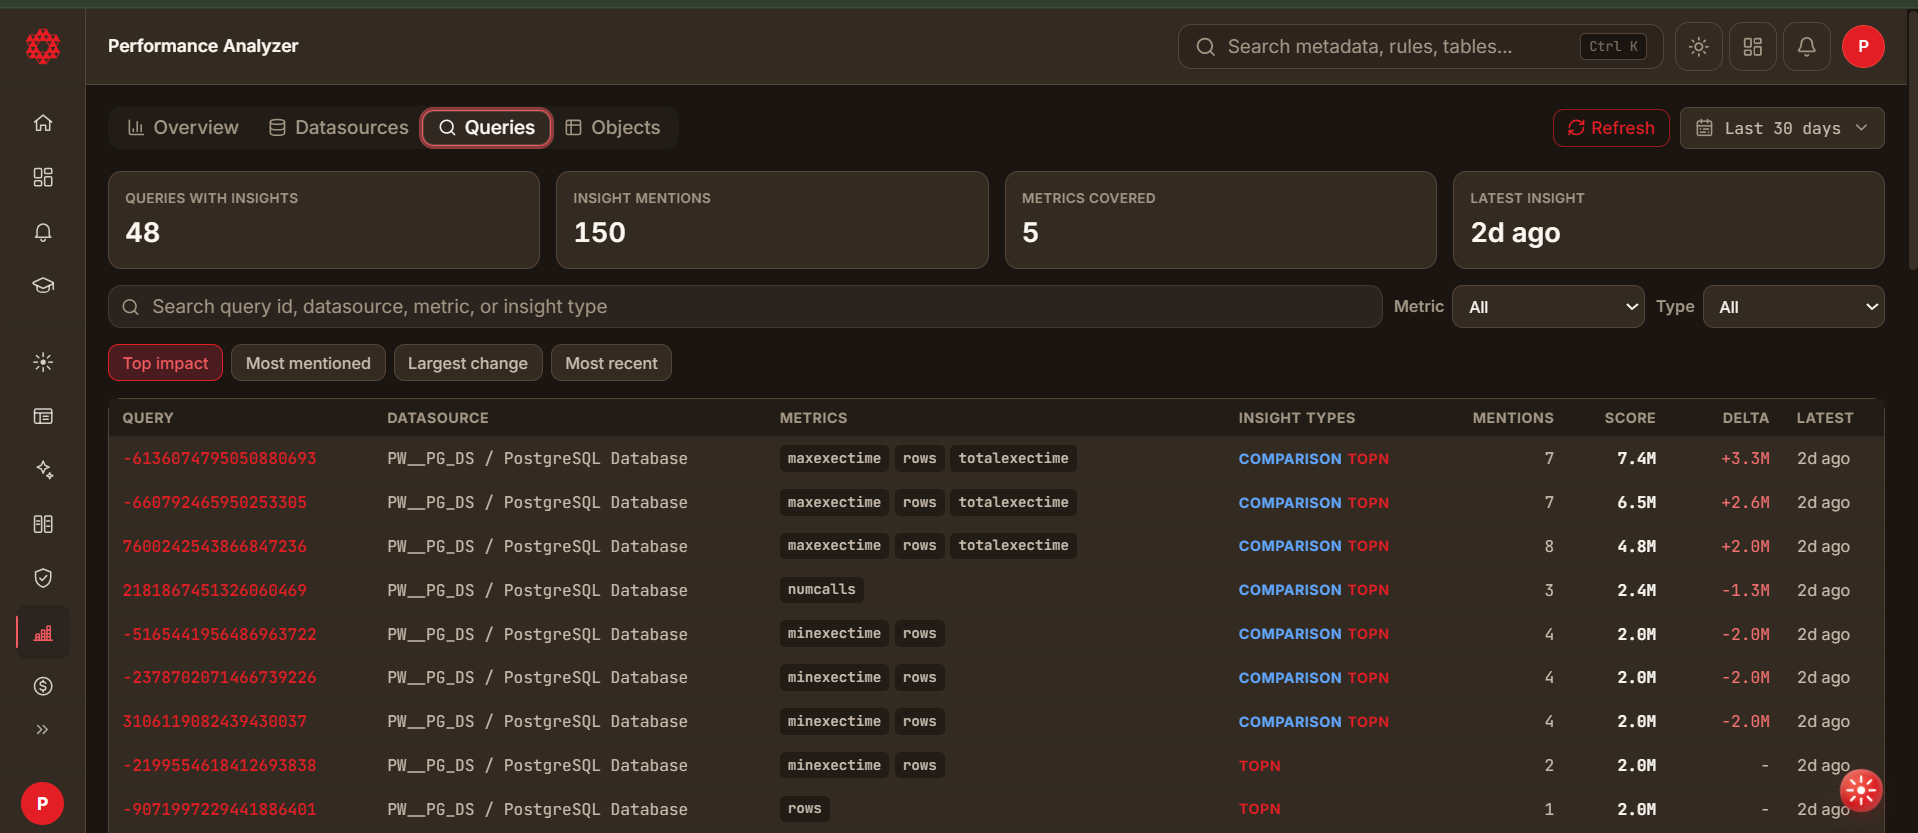
Access the Queries tab from the top navigation bar of Performance Analyzer:
Features & Controls
- Summary Metrics Cards: Shows Queries with Insights (e.g. 48), Insight Mentions (e.g. 150), Metrics Covered (e.g. 5), and Latest Insight timestamp.
- Search Bar: Search by Query ID, datasource name, metric name, or insight type.
- Filter Dropdowns: Filter by Metric (e.g.
maxexectime,rows,totalexectime,numcalls) and Insight Type (e.g.TOPN,COMPARISON,FORECAST). - Sort Presets: Quickly sort query results by:
- Top impact (Highest resource utilization impact)
- Most mentioned (Most frequently cited across insight cards)
- Largest change (Largest delta in execution behavior)
- Most recent (Latest observed query activity)
Query Detail & Query Plan View
Clicking any Query ID link in the Queries table opens the dedicated Query Detail view:
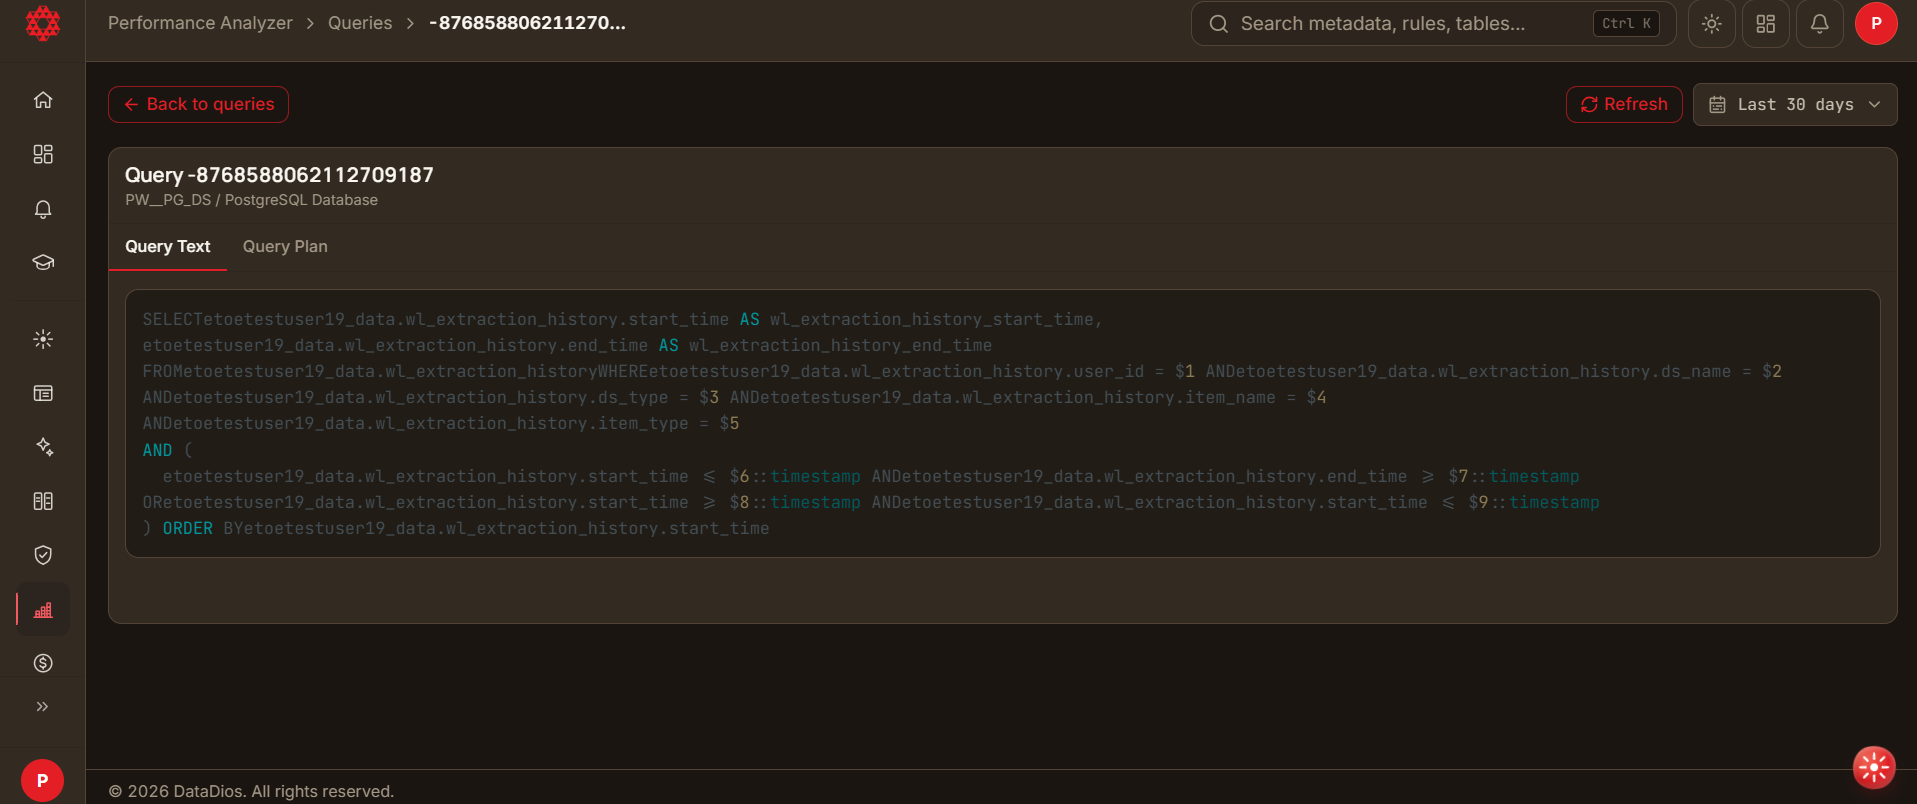
- Query Text Tab: Displays the full, syntax-highlighted SQL query string with parameter placeholders.
- Query Plan Tab: Visualizes or outputs the database execution query plan tree (e.g., Sequential Scan, Index Scan, Nested Loop Join), helping DBAs identify missing indexes or expensive execution operators.
- AI Insights: When the query contains enough detail and AI reasoning is configured, expand the inline AI Insights banner above these tabs to request a compact explanation, findings, recommendations, risks, and next steps. See AI Insights.
- Back to Queries Button: Return to the main query browser list with your active search filters preserved.
Objects Browser
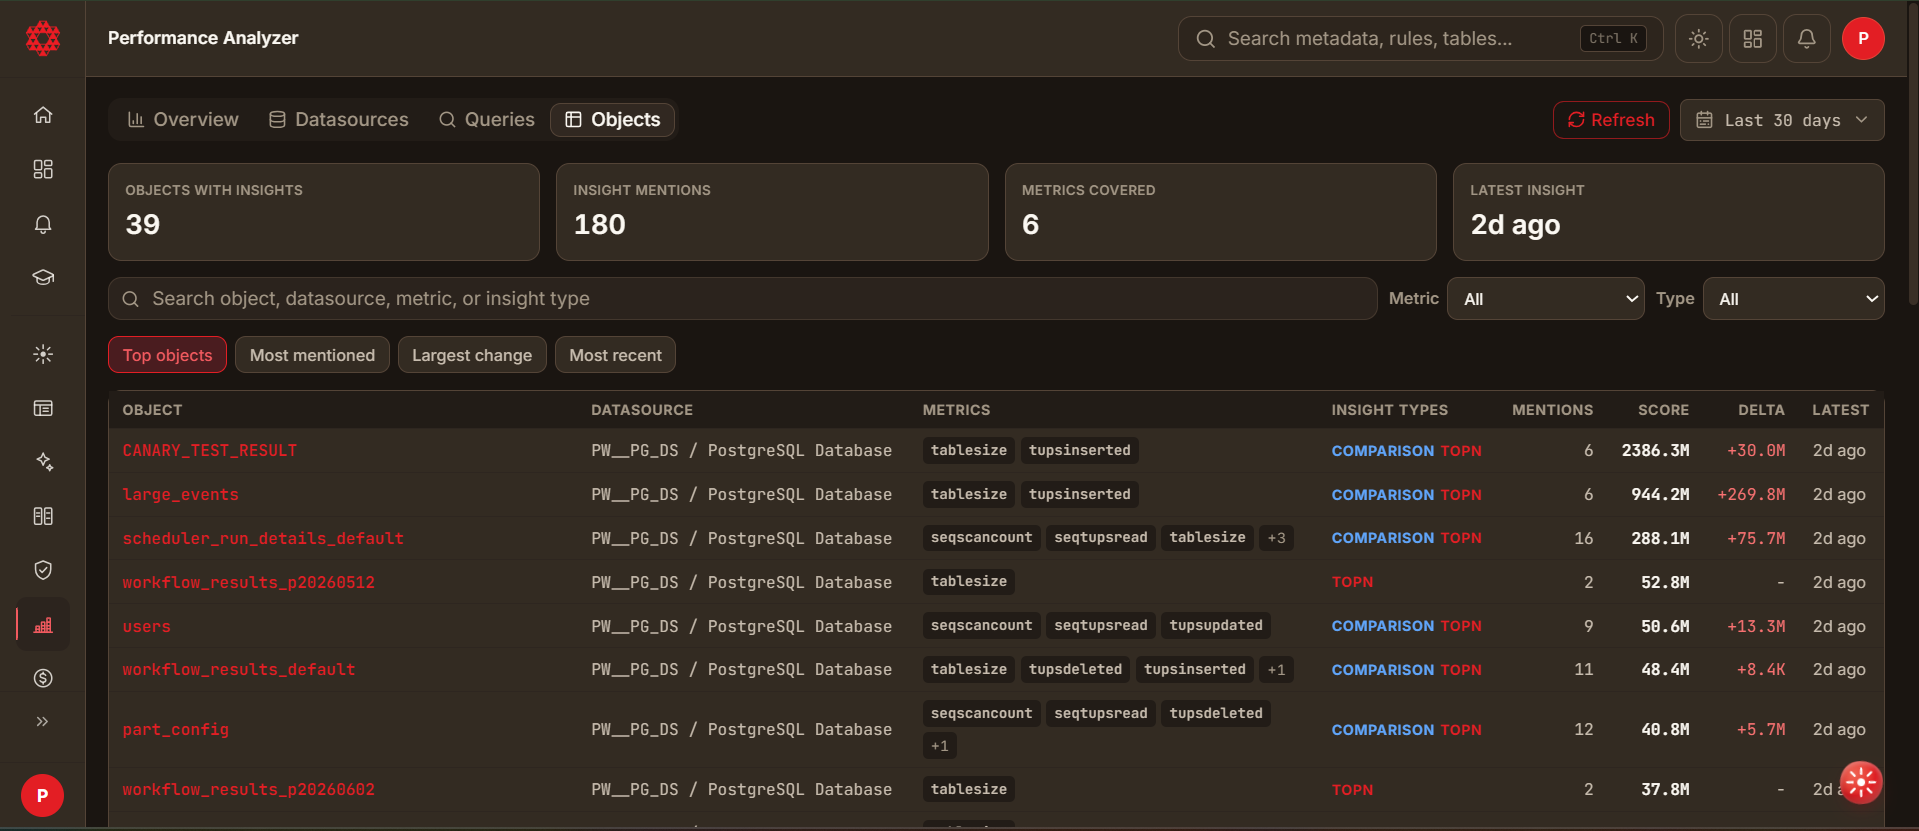
Access the Objects tab from the top navigation bar:
Features & Controls
- Summary Statistics: Displays Objects with Insights (e.g. 39), Insight Mentions (e.g. 180), Metrics Covered, and Latest Insight.
- Search & Filter: Search database tables, views, or schemas across connected data sources.
- Table Metrics: Tracks object-level metrics including
tablesize,tupsinserted,seqscancount,seqtupsread, andtupsupdated. - Top Objects Sort: Easily isolate top database tables driving storage growth or scan activity across your infrastructure.