Enabling Workload Analysis
Before Performance Analyzer can populate metrics, workload extraction must be enabled for target data sources. DataDios collects query execution statistics, wait events, resource utilization, and storage growth over configurable extraction windows.
There are two ways to enable workload analysis for a data source:
- When creating a new data source in Data Explorer.
- For an existing data source via the Edit Data Source settings.
The two video walkthroughs on this page were recorded before 2026-09-09 and show a Lineage tab in the dialog. That tab was removed; the written steps are current. Re-recording is tracked in dd-docs#208.
Method 1 — Enabling Workload Analysis when Creating a New Data Source
Watch the video walkthrough for enabling workload analysis during new data source connection creation:
Step-by-Step Instructions
- Navigate to Data Explorer in the left navigation sidebar and click + Add connection.
- In the Add Connection form modal, fill in the connection credentials and parameters (Name, Type, Host, Port, Username, Password, Database Name, Schema) under the Connection tab.
- Click Test Connection to confirm connectivity until the banner displays "Successfully connected to the Database".
- On the right-hand side of the connection form modal, select the Workload tab (positioned alongside Connection, Drift, and Profiling). The RAG settings tab is not offered here; it appears only when editing an existing source.
- In the Workload analysis section, toggle Enable workload analysis to the ON position.
- Configure the collection settings:
- Schedule: Select the collection interval — Hourly, Daily, or Weekly.
- Historical Window Notification: "Workload extraction will start (30-day window) when you save."
- Workflows: Review the checklist of metrics to collect (e.g. for PostgreSQL: PG Table Storage Usage, PG Database Storage Usage, PG Query Workload, PG DB Workload, PG DB Workload Tuples, PGMQ Queue Workload). All workflows are enabled by default. Uncheck any workflow you wish to exclude.
- Click Save.
- A confirmation toast appears: "Workload extraction started (30-day window)."
The newly configured data source will now appear under Performance Analyzer → Datasources.
Method 2 — Enabling Workload Analysis on an Existing Data Source
Watch the video walkthrough for enabling workload analysis on an already configured data source:
Step-by-Step Instructions
- Navigate to Data Explorer and locate your target data source in the Sources list.
- In the Actions column on the right, click the Edit (pencil) icon to open the Edit data source modal.
- Switch to the Workload tab on the right side of the modal (alongside Connection, Drift, Profiling, and RAG settings).
- Locate the Workload analysis panel and toggle Enable workload analysis to ON.
- Select your desired extraction Schedule (Hourly, Daily, or Weekly).
- Check or uncheck individual collection workflows according to your monitoring requirements (options vary based on database type, e.g. MySQL includes MySQL Table Storage Usage, MySQL Query Workload, MySQL IO Workload, MySQL Active Session Workload).
- Click Save. The system immediately schedules background extraction with an initial 30-day lookback window.
Datasources Tab (Status & Monitoring)
Once workload analysis is enabled across your data sources, navigate to Performance Analyzer → Datasources to monitor collection health and execution telemetry:
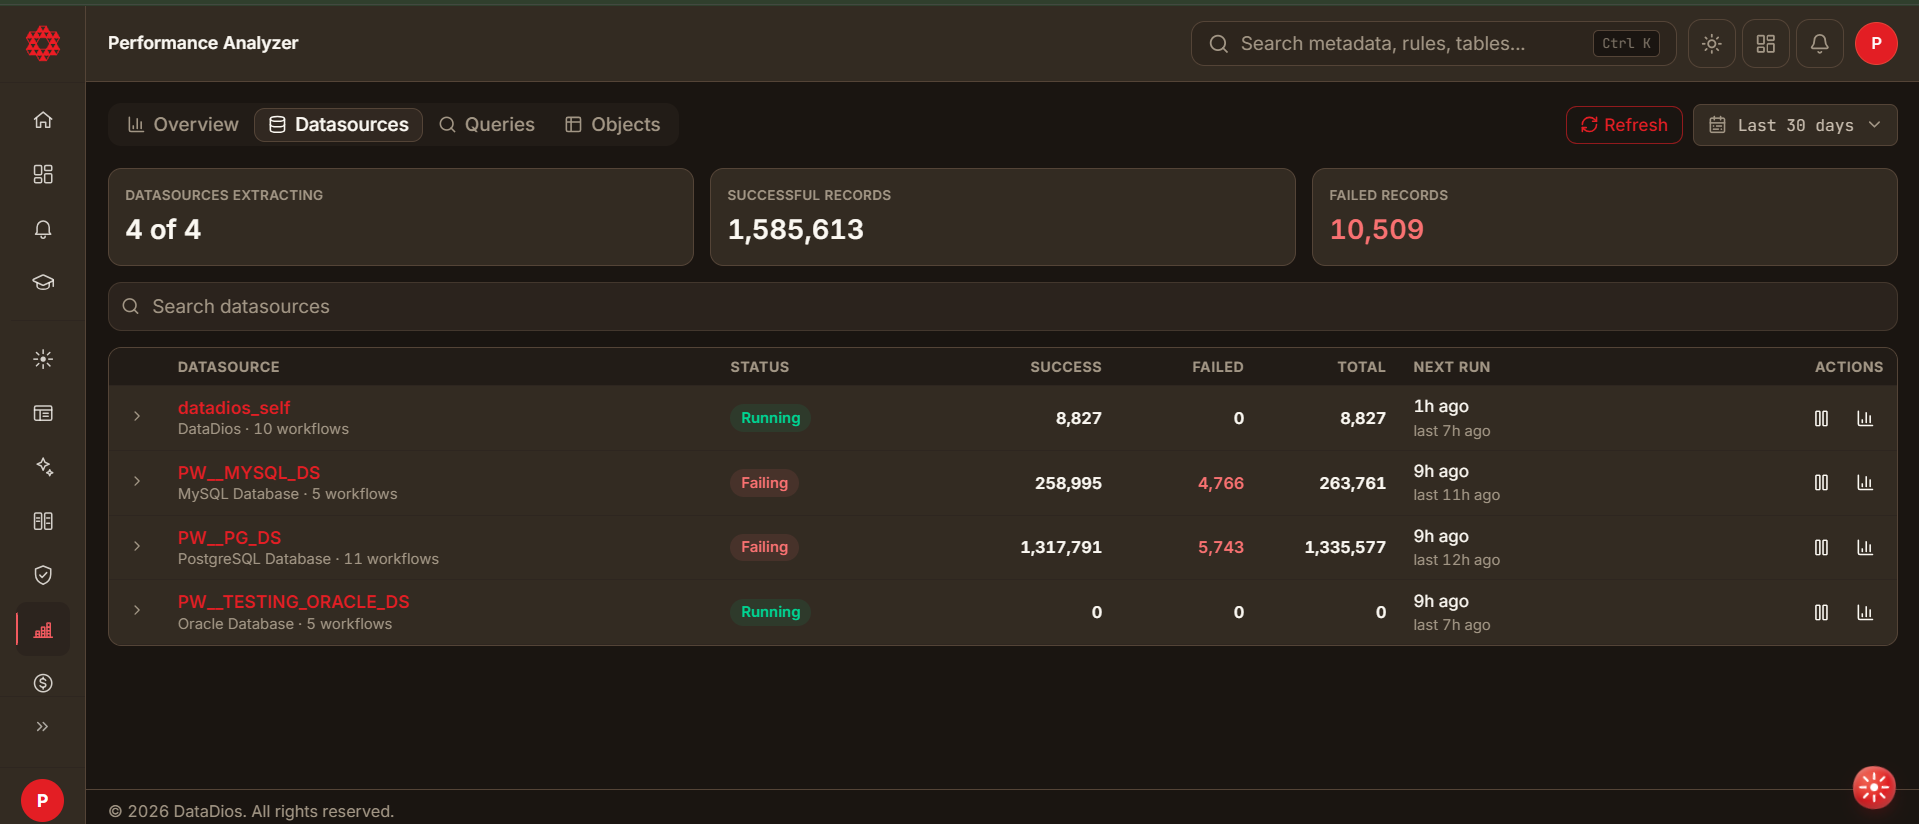
Key Metrics on the Datasources View
- Status: Indicates current execution state (
Running,Idle, orFailing). - Records Processed: Total successful vs. failed workload metrics collected.
- Schedule Interval: Current extraction frequency (Hourly, Daily, Weekly).
- Next Run Time: Timestamp of the next scheduled collection run.
- Actions: Direct link to open the data source's Workload Dashboard.