Logs
Overview
Logs exposes the platform's server-side log files. Files are grouped by the service that wrote them, and opening one gives a filterable viewer with timestamps, levels and messages.
Logs is available only to administrators of the default tenant.
Navigation
Open Manage from the left-hand sidebar, then select Logs under the OBSERVABILITY group. The page opens at /manage/logs.
Logs replaces the Manage navigation with its own file list. Use the ← MANAGE link at the top of that list to go back.
Choosing a file
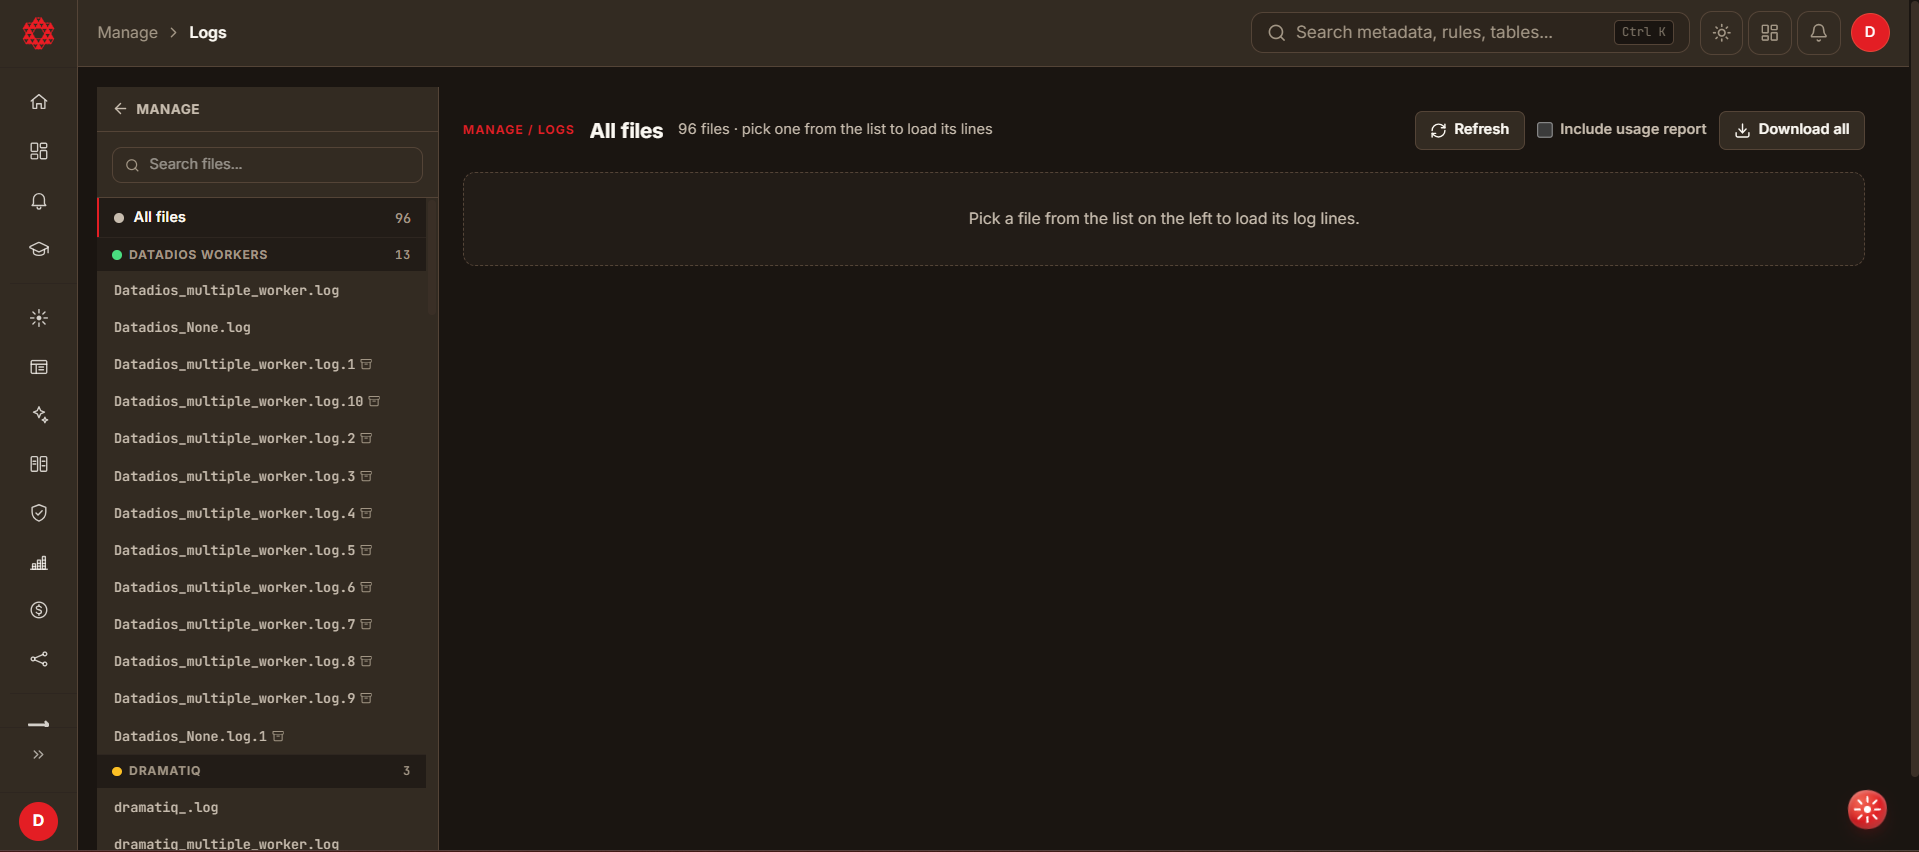
The left-hand panel lists every available log file.
- All files shows the total count across all groups.
- Search files… filters the list by filename.
- Files are grouped by service. Each group header carries its own count.
| Group | Contains |
|---|---|
| Datadios workers | The main application workers. |
| Dramatiq | The background task queue. |
| Flask web | The web application layer. |
| LLM usage | Language-model usage records. |
| Performance | Performance and profiling output. |
| Other | Everything else, including nginx access and error logs, and OS-level logs such as dpkg.log. |
Rotated files appear alongside the file they came from, numbered — dramatiq_multiple_worker.log.1 and so on.
Until you pick a file, the page reads "Pick a file from the list on the left to load its log lines."
Above the list, Refresh re-reads the available files, Include usage report adds usage data, and Download all downloads the full set.
Reading a file
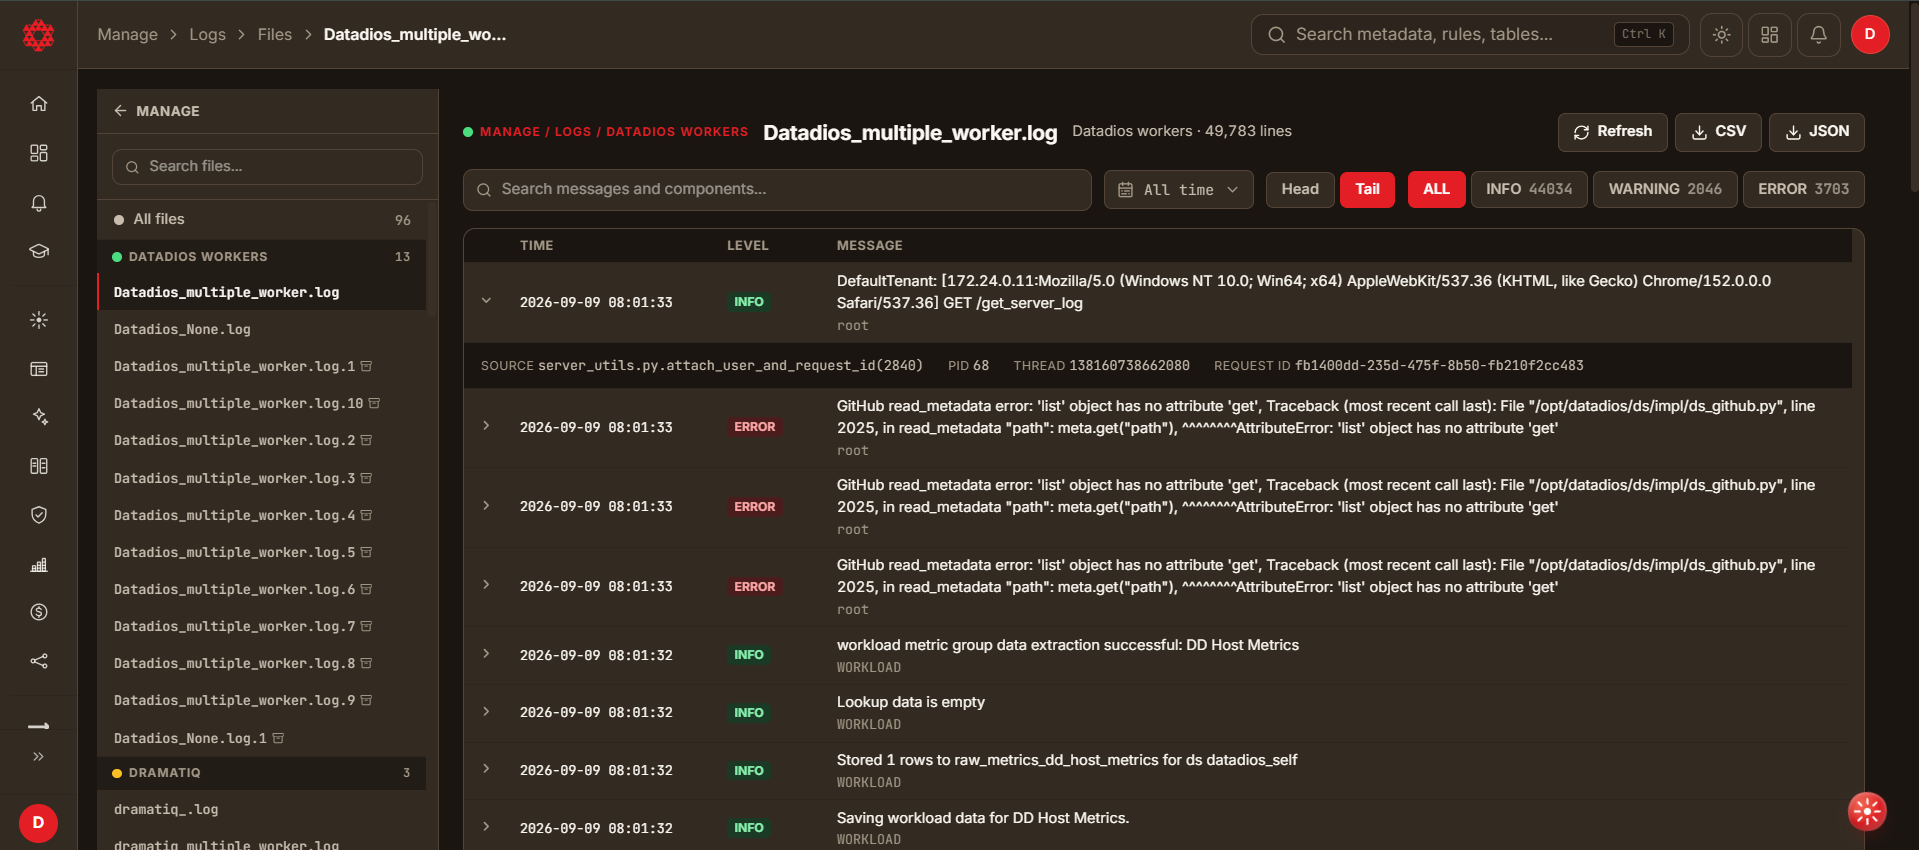
Selecting a file opens the viewer. The header shows the filename, its group and the number of lines it contains.
Filtering
| Control | What it does |
|---|---|
| Search messages and components… | Filters by message text or the component that logged it. |
| Time range | Narrows to a period. Defaults to All time. |
| Head / Tail / ALL | Reads from the start of the file, the end of it, or the whole thing. |
| INFO / WARNING / ERROR | Filters by level. Each carries a count for the current file. |
The level counts are the fastest way to judge a file: a file with a non-zero ERROR count is worth opening, and selecting ERROR jumps straight to those lines.
Large files are quicker to work with using Tail, which reads from the end. Log files here can run to tens of thousands of lines, and ALL loads all of them.
Columns
| Column | Description |
|---|---|
| TIME | Timestamp of the entry. |
| LEVEL | INFO, WARNING or ERROR. |
| MESSAGE | The log message, with the component that emitted it beneath. Expand a row to see the full entry. |
Exporting
CSV and JSON export the current file, and Refresh re-reads it from disk.
Related pages
- Scheduler — for job failures, start with the job's run history rather than the raw logs.