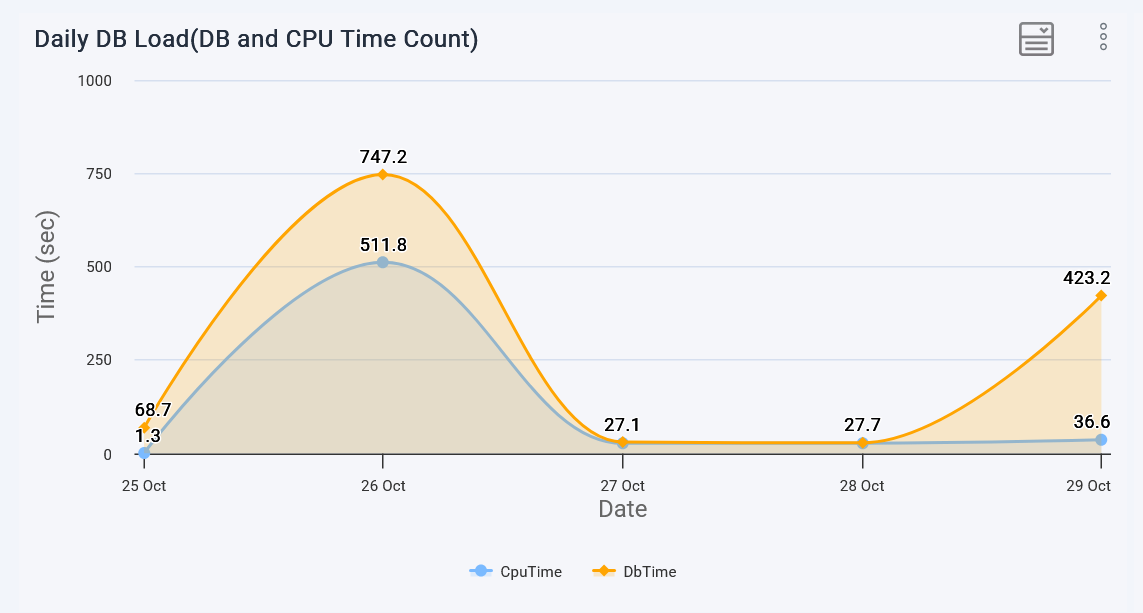
The first graph in the top section of the workload graphs page.
The graph plots two important metrics as the name suggests.
DB Time - The amount of time all of the databases spent executing queries.
This includes queries spent time on CPU.
Time spent waiting to read from / write to client connections.
Time spent waiting to read / write data to disk blocks.
Time spent on waiting to acquire locks, etc.
CPU Time - The amount of time queries run on the CPU.
If the DB time is high, while the CPU time is low, it means, queries are spending time on either I/O or waiting for
locks. Either case, take a fresh look at the queries to reduce DB time.
If the CPU time is high, it means the queries are taking longer to execute.
In this case you may need to improve the queries
Or you are running low on CPU resource, consider increasing the CPU core count.