Dependency Graphs
Dependency Graph
Dependency graph displays the relation between a query and the underlying assets (tables / views) it is using. To view the dependency graph, follow these steps:
- Click on the dependency graph icon as shown in the pic. A popup will appear showing the dependency graph.

- The graph indicate which query uses which table / view.
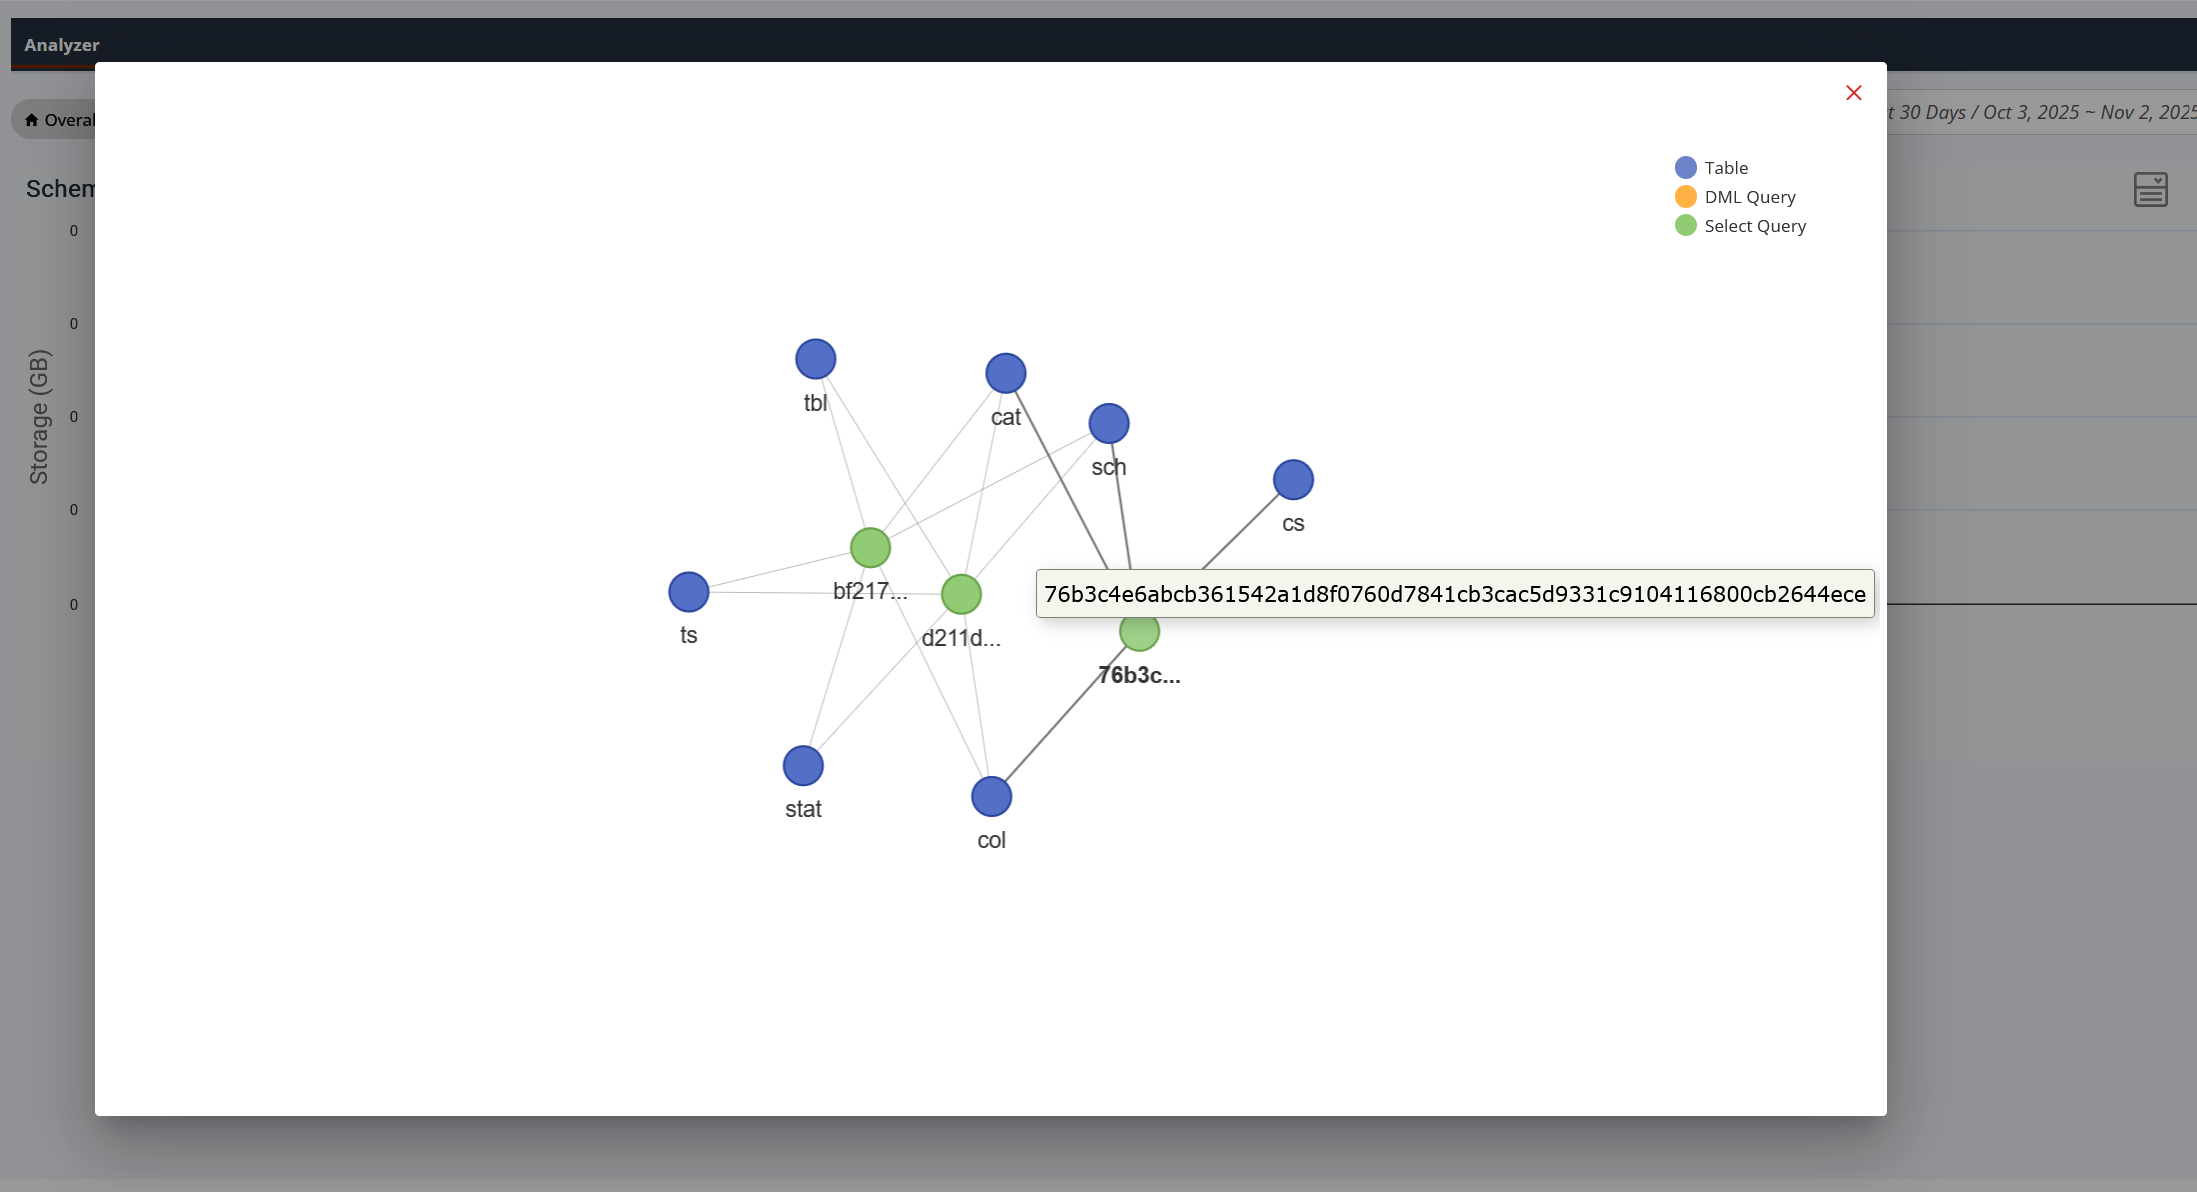
- As the legend indicates:
- Green circle - regular query.
- Orange circle - DML (Data Manipulation Language) query such as INSERT, UPDATE, DELETE etc.
- Purple / blue circle - Table / view.
- Hover over a circle to see complete name of the query or the table / view.