SQL Server
This section explains how to create and test an SQL Server data source in DataDios.
Steps to Create and Test an SQL Server Data Source
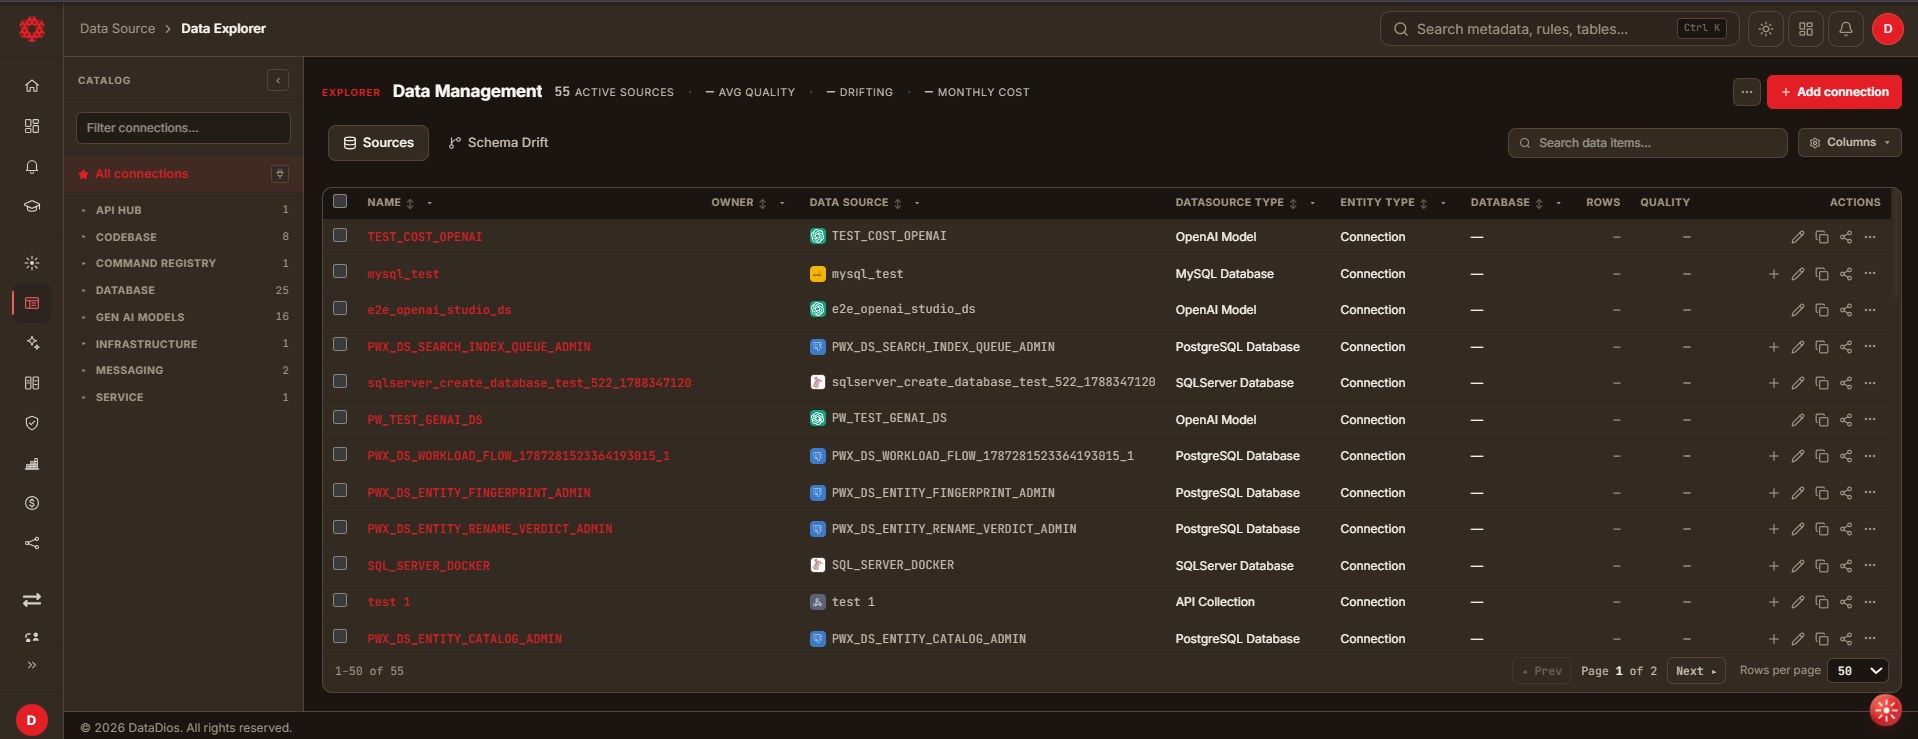
Step 1: Create a Data Source
- Navigate to Data Explorer from the left navigation menu.
- Click + Add connection in the top-right corner. The Create data source dialog opens.
- Under Identity, enter a Name for the connection and select SQLServer Database from the searchable Type dropdown — it is listed under the Database group.
Step 2: Fill Connection Details
In the Connection Parameters section, provide:
- Group: (Optional) grouping label for connections
- Host: SQL Server host or IP address (required)
- Port: SQL Server port (default:
1433) - Service Type: On-prem or Cloud
- Username: SQL Server login username (required)
- Select Secret Source: choose Direct Input to type the password here, or From Secret Store to reference a configured secret store
- Password: the password for that login (required; the field reads Enter Secret Key)
- Database: database to connect to
- Schema: schema you want to connect to
- Object Types: choose whether to fetch
tables,views, or both - Version: SQL Server 2022 or SQL Server 2014 — leave it blank if neither applies
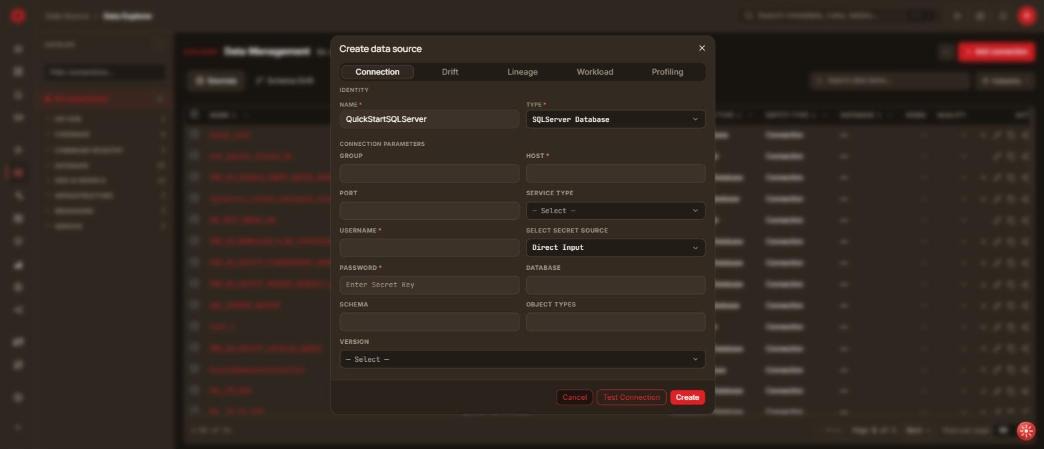
The dialog also carries Drift, Lineage, Workload and Profiling tabs. These are optional and can be turned on later from Edit:
- Drift — toggle Enable drift tracking to record schema changes (new columns, type changes, dropped tables) in the drift timeline.
- Lineage — toggle Build lineage after creating to trace data flow across pipelines and jobs.
- Workload — toggle Enable workload analysis (and optionally Enable insight extraction), then pick from the SQL Server workflows: SS DB Storage Usage, SS Table Storage Usage, SS Query Workload and SS DB WORKLOAD.
- Profiling — toggle Enable data profiling to collect table- and column-level facts for quality rules and search.
Step 3: Test Connection
Click Test Connection to validate the host, credentials and database before saving.
Step 4: Save Data Source
If the test succeeds, click Create. You land back on the Sources list, and the new SQL Server connection appears under the Database category in the left Catalog panel.
To change it later, click the Edit connection (pencil) icon on its row. The Edit data source dialog carries the same tabs plus a RAG settings tab, and saves with Save instead of Create. Not every connector gets that tab — the Ollama Edit dialog, for instance, does not show it.
Step 5: Explore Data Source Items
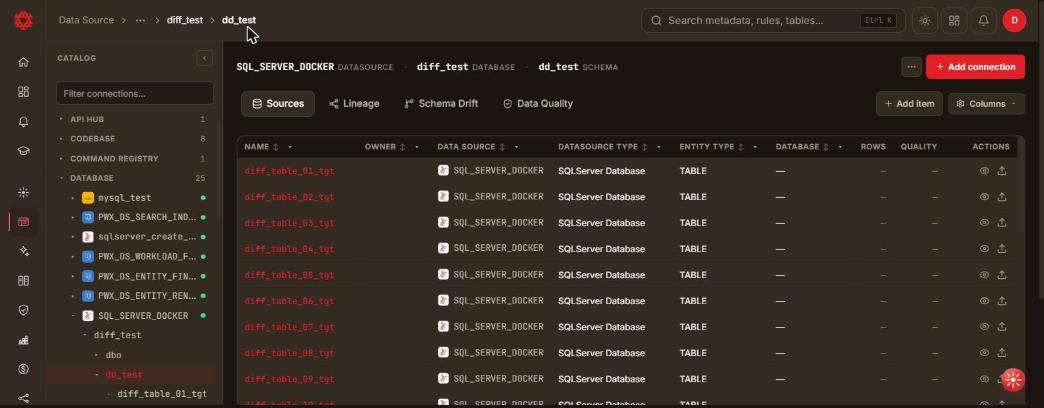
Click the connection's name to drill down through its hierarchy — connection → database → schema → table — with tabs that change at each level:
| Level | Tabs |
|---|---|
| Connection | Sources · Lineage · Schema Drift · Data Quality |
| Database | Sources · Lineage · Schema Drift · Data Quality |
| Schema | Sources · Lineage · Schema Drift · Data Quality |
| Table | Metadata · Data Preview · Profile · Quality Rules · Lineage · History |
At schema level the Sources tab lists every table and view in that schema, and the breadcrumb shows where you are in the hierarchy.
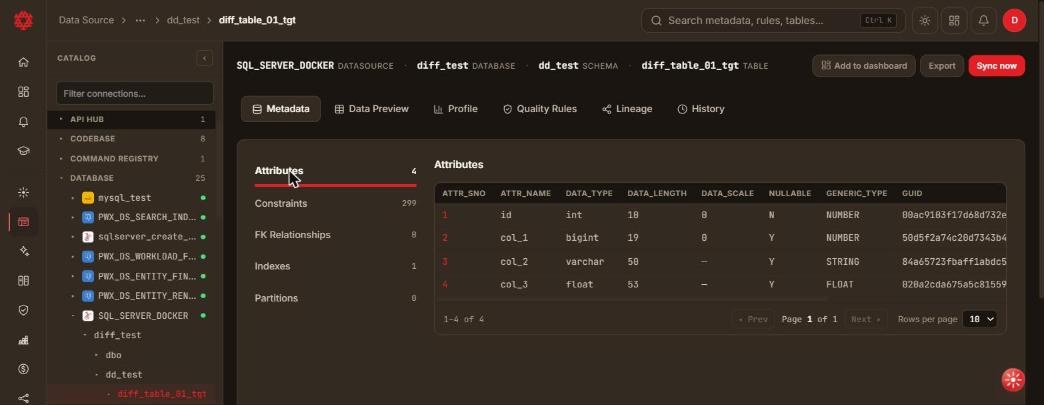
Open a table to view its Metadata tab, which groups the object's structure into Attributes, Constraints, FK Relationships, Indexes and Partitions. The Attributes table lists ATTR_SNO, ATTR_NAME, DATA_TYPE, DATA_LENGTH, DATA_SCALE, NULLABLE, GENERIC_TYPE and GUID.
Other tabs on the same table:
- Data Preview — a row-level data grid of the table's actual content.
- Profile — column- and table-level profiling facts, populated when Enable data profiling is on for the connection.
- Quality Rules — the rules configured for this table. For detailed information, refer to the Data Quality documentation.
- Lineage — upstream and downstream relationships for the table.
- History — how the object has changed over time.
Add to dashboard, Export and Sync now are available from the table header.
The SQL Server connector has no Schedule Sync field in the new UI. Metadata is refreshed from the connection's Refresh action and from Sync now on an individual object; for how the resulting history is presented, see the Metadata Timeline.