- The primary chart in the top section of the Analyzer tab shows the load on the database system broken down by wait events.
- Each stacked bar represents average active session load at a specific point in time over the selected timeline.
- The load is measured in terms of Average Active Sessions (AAS).
- The X-axis represents time and the Y-axis represents average active session load.
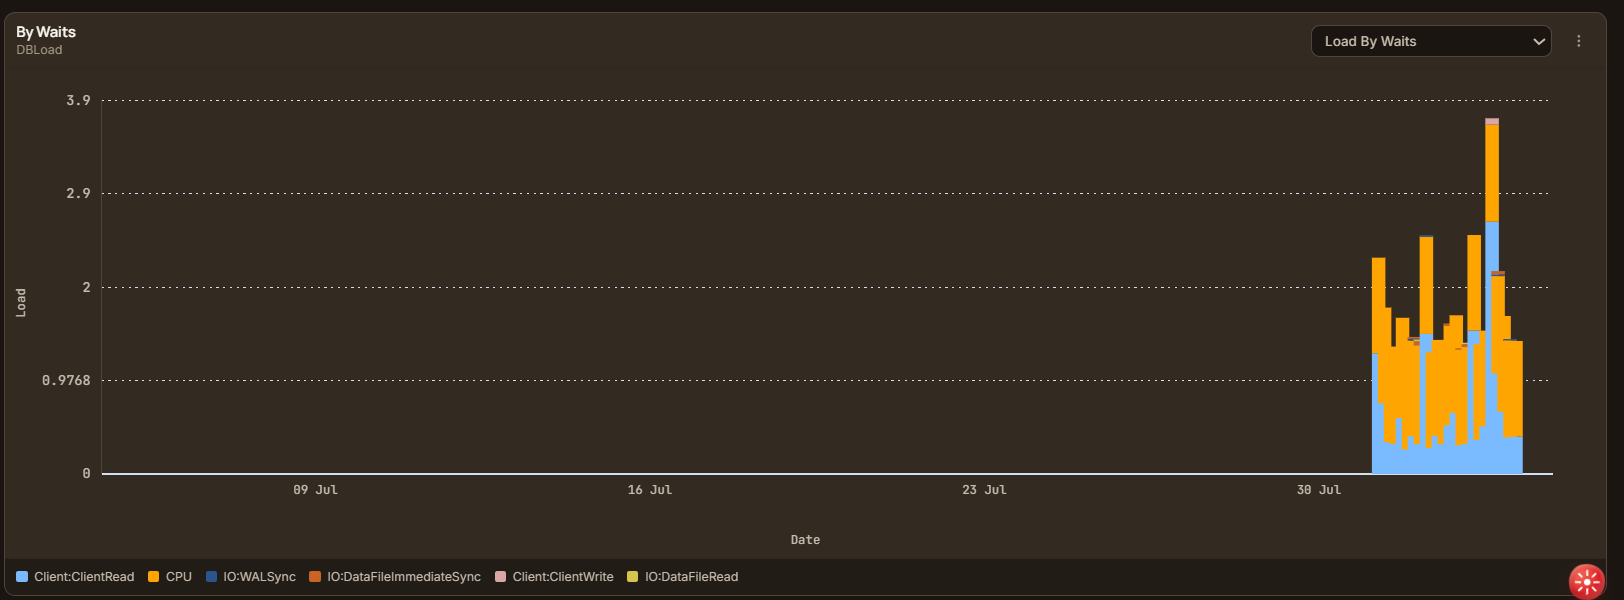
- Hover over any bar to view exact wait event breakdown details.
- Higher peaks indicate higher resource load on the system at that timestamp.
- Common wait event types surfaced include:
- CPU: Active processing on CPU cores.
- Client:ClientRead: Waiting for client applications to send commands.
- IO:WALSync / IO:DataFileRead: Waiting on disk I/O for log sync or file reads.
- Locks / IPC: Concurrency lock contention.
- High load scenarios are typically driven by specific queries. Use the Queries tab to isolate and fine-tune high-impact SQL statements.